Jamaican vs Armenian Disability
COMPARE
Jamaican
Armenian
Disability
Disability Comparison
Jamaicans
Armenians
12.1%
DISABILITY
3.3/ 100
METRIC RATING
226th/ 347
METRIC RANK
11.6%
DISABILITY
65.9/ 100
METRIC RATING
158th/ 347
METRIC RANK
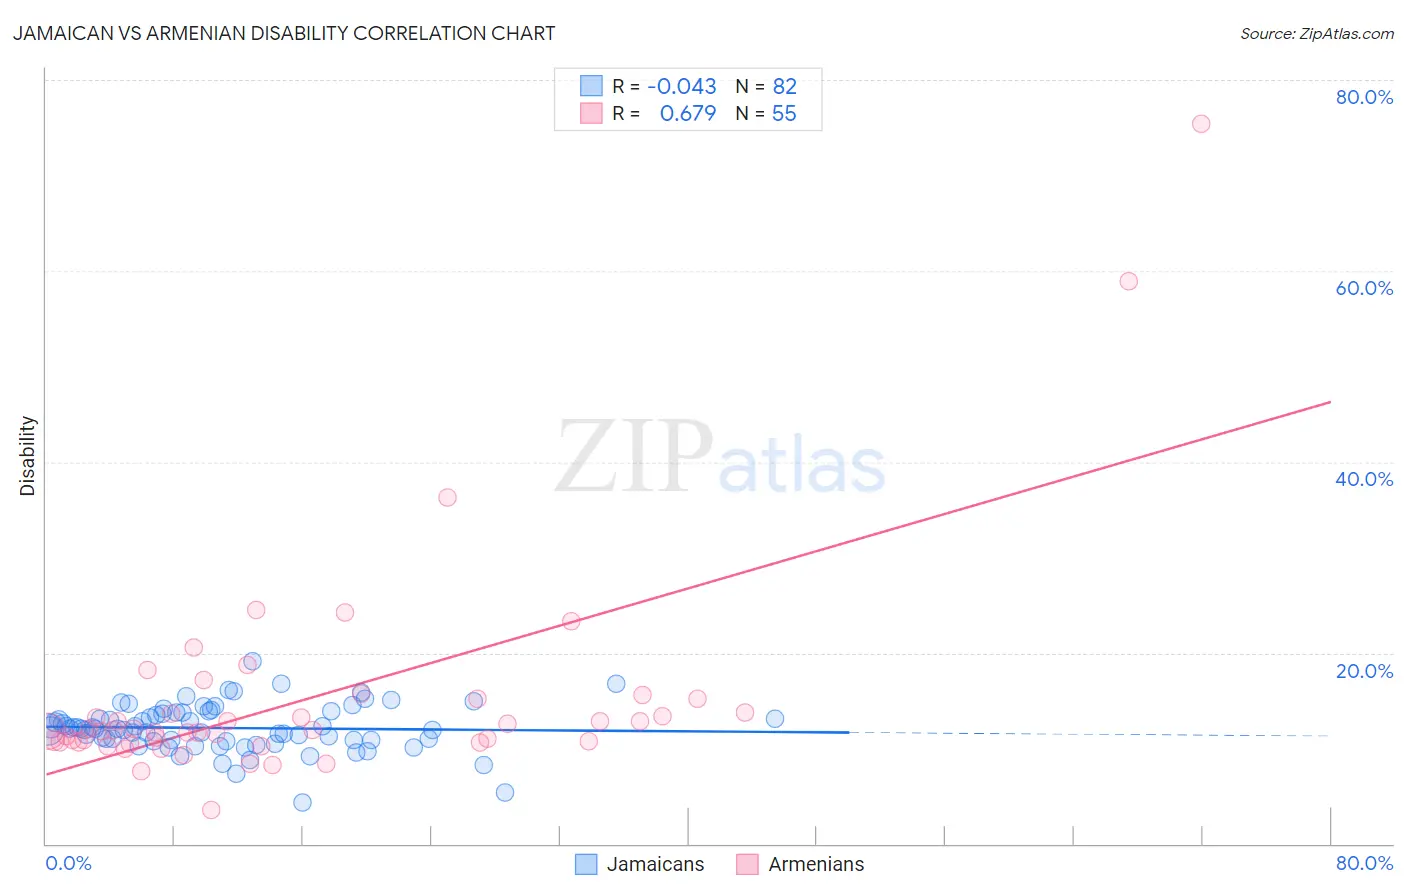
Jamaican vs Armenian Disability Correlation Chart
The statistical analysis conducted on geographies consisting of 367,991,297 people shows no correlation between the proportion of Jamaicans and percentage of population with a disability in the United States with a correlation coefficient (R) of -0.043 and weighted average of 12.1%. Similarly, the statistical analysis conducted on geographies consisting of 310,943,195 people shows a significant positive correlation between the proportion of Armenians and percentage of population with a disability in the United States with a correlation coefficient (R) of 0.679 and weighted average of 11.6%, a difference of 4.5%.
Disability Correlation Summary
| Measurement | Jamaican | Armenian |
| Minimum | 4.3% | 3.6% |
| Maximum | 19.1% | 75.4% |
| Range | 14.8% | 71.8% |
| Mean | 12.1% | 15.1% |
| Median | 12.0% | 11.9% |
| Interquartile 25% (IQ1) | 10.8% | 10.7% |
| Interquartile 75% (IQ3) | 13.7% | 15.1% |
| Interquartile Range (IQR) | 2.9% | 4.4% |
| Standard Deviation (Sample) | 2.4% | 11.5% |
| Standard Deviation (Population) | 2.4% | 11.4% |
Similar Demographics by Disability
Demographics Similar to Jamaicans by Disability
In terms of disability, the demographic groups most similar to Jamaicans are Alsatian (12.1%, a difference of 0.010%), Senegalese (12.1%, a difference of 0.050%), Mexican (12.1%, a difference of 0.13%), West Indian (12.2%, a difference of 0.15%), and Inupiat (12.2%, a difference of 0.17%).
| Demographics | Rating | Rank | Disability |
| Croatians | 4.9 /100 | #219 | Tragic 12.1% |
| Immigrants | Bahamas | 4.7 /100 | #220 | Tragic 12.1% |
| Northern Europeans | 4.2 /100 | #221 | Tragic 12.1% |
| Spanish American Indians | 4.1 /100 | #222 | Tragic 12.1% |
| Hispanics or Latinos | 3.9 /100 | #223 | Tragic 12.1% |
| Mexicans | 3.7 /100 | #224 | Tragic 12.1% |
| Senegalese | 3.5 /100 | #225 | Tragic 12.1% |
| Jamaicans | 3.3 /100 | #226 | Tragic 12.1% |
| Alsatians | 3.3 /100 | #227 | Tragic 12.1% |
| West Indians | 2.9 /100 | #228 | Tragic 12.2% |
| Inupiat | 2.8 /100 | #229 | Tragic 12.2% |
| Samoans | 2.6 /100 | #230 | Tragic 12.2% |
| Malaysians | 2.5 /100 | #231 | Tragic 12.2% |
| Italians | 2.5 /100 | #232 | Tragic 12.2% |
| Bahamians | 2.3 /100 | #233 | Tragic 12.2% |
Demographics Similar to Armenians by Disability
In terms of disability, the demographic groups most similar to Armenians are Guatemalan (11.6%, a difference of 0.040%), Immigrants from Barbados (11.6%, a difference of 0.080%), Immigrants from Cuba (11.6%, a difference of 0.15%), Immigrants from Middle Africa (11.6%, a difference of 0.18%), and Immigrants from Fiji (11.6%, a difference of 0.19%).
| Demographics | Rating | Rank | Disability |
| Immigrants | Kenya | 72.1 /100 | #151 | Good 11.6% |
| Immigrants | Moldova | 72.0 /100 | #152 | Good 11.6% |
| Immigrants | Ghana | 71.2 /100 | #153 | Good 11.6% |
| Immigrants | Guatemala | 71.1 /100 | #154 | Good 11.6% |
| Immigrants | Netherlands | 69.8 /100 | #155 | Good 11.6% |
| Immigrants | Fiji | 69.5 /100 | #156 | Good 11.6% |
| Immigrants | Middle Africa | 69.5 /100 | #157 | Good 11.6% |
| Armenians | 65.9 /100 | #158 | Good 11.6% |
| Guatemalans | 65.1 /100 | #159 | Good 11.6% |
| Immigrants | Barbados | 64.2 /100 | #160 | Good 11.6% |
| Immigrants | Cuba | 62.8 /100 | #161 | Good 11.6% |
| Immigrants | Haiti | 59.2 /100 | #162 | Average 11.7% |
| Immigrants | Trinidad and Tobago | 58.9 /100 | #163 | Average 11.7% |
| Syrians | 58.5 /100 | #164 | Average 11.7% |
| Cubans | 56.7 /100 | #165 | Average 11.7% |