Jamaican vs Immigrants from Lithuania Hearing Disability
COMPARE
Jamaican
Immigrants from Lithuania
Hearing Disability
Hearing Disability Comparison
Jamaicans
Immigrants from Lithuania
2.7%
HEARING DISABILITY
99.0/ 100
METRIC RATING
52nd/ 347
METRIC RANK
2.9%
HEARING DISABILITY
73.0/ 100
METRIC RATING
152nd/ 347
METRIC RANK
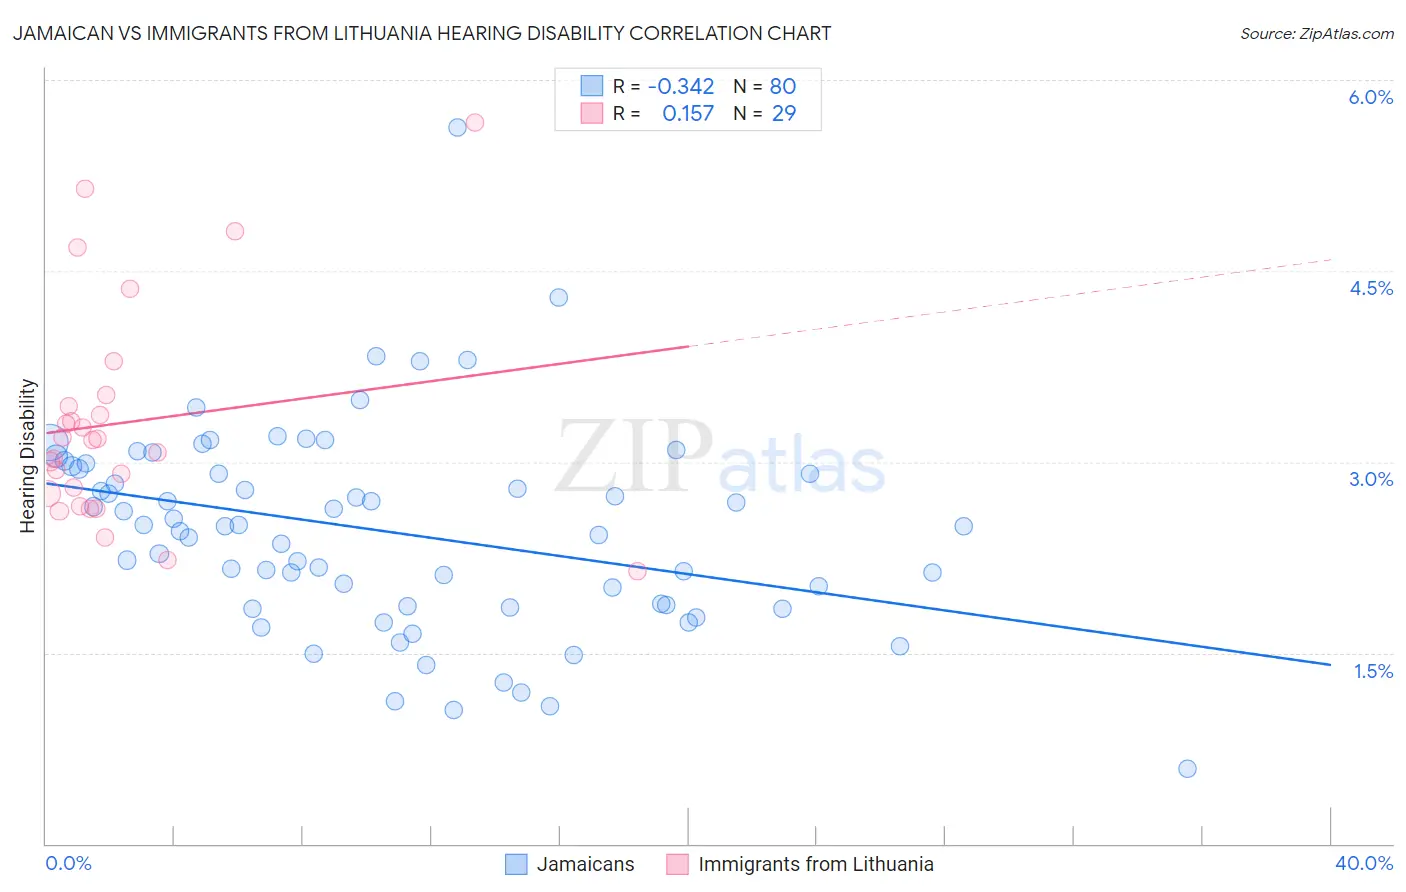
Jamaican vs Immigrants from Lithuania Hearing Disability Correlation Chart
The statistical analysis conducted on geographies consisting of 367,784,846 people shows a mild negative correlation between the proportion of Jamaicans and percentage of population with hearing disability in the United States with a correlation coefficient (R) of -0.342 and weighted average of 2.7%. Similarly, the statistical analysis conducted on geographies consisting of 117,714,489 people shows a poor positive correlation between the proportion of Immigrants from Lithuania and percentage of population with hearing disability in the United States with a correlation coefficient (R) of 0.157 and weighted average of 2.9%, a difference of 9.6%.
Hearing Disability Correlation Summary
| Measurement | Jamaican | Immigrants from Lithuania |
| Minimum | 0.58% | 2.1% |
| Maximum | 5.6% | 5.7% |
| Range | 5.0% | 3.5% |
| Mean | 2.5% | 3.3% |
| Median | 2.5% | 3.2% |
| Interquartile 25% (IQ1) | 1.9% | 2.7% |
| Interquartile 75% (IQ3) | 3.0% | 3.5% |
| Interquartile Range (IQR) | 1.1% | 0.78% |
| Standard Deviation (Sample) | 0.80% | 0.86% |
| Standard Deviation (Population) | 0.80% | 0.85% |
Similar Demographics by Hearing Disability
Demographics Similar to Jamaicans by Hearing Disability
In terms of hearing disability, the demographic groups most similar to Jamaicans are Immigrants from Eastern Asia (2.7%, a difference of 0.070%), Ethiopian (2.7%, a difference of 0.10%), Immigrants from Ethiopia (2.7%, a difference of 0.16%), Immigrants from Nicaragua (2.7%, a difference of 0.19%), and South American (2.7%, a difference of 0.23%).
| Demographics | Rating | Rank | Hearing Disability |
| Venezuelans | 99.4 /100 | #45 | Exceptional 2.6% |
| Immigrants | Dominica | 99.3 /100 | #46 | Exceptional 2.6% |
| Immigrants | Israel | 99.3 /100 | #47 | Exceptional 2.6% |
| Immigrants | Singapore | 99.3 /100 | #48 | Exceptional 2.6% |
| Immigrants | South America | 99.2 /100 | #49 | Exceptional 2.7% |
| Paraguayans | 99.2 /100 | #50 | Exceptional 2.7% |
| Immigrants | Hong Kong | 99.2 /100 | #51 | Exceptional 2.7% |
| Jamaicans | 99.0 /100 | #52 | Exceptional 2.7% |
| Immigrants | Eastern Asia | 99.0 /100 | #53 | Exceptional 2.7% |
| Ethiopians | 99.0 /100 | #54 | Exceptional 2.7% |
| Immigrants | Ethiopia | 99.0 /100 | #55 | Exceptional 2.7% |
| Immigrants | Nicaragua | 99.0 /100 | #56 | Exceptional 2.7% |
| South Americans | 99.0 /100 | #57 | Exceptional 2.7% |
| Immigrants | Peru | 98.6 /100 | #58 | Exceptional 2.7% |
| Immigrants | Eritrea | 98.5 /100 | #59 | Exceptional 2.7% |
Demographics Similar to Immigrants from Lithuania by Hearing Disability
In terms of hearing disability, the demographic groups most similar to Immigrants from Lithuania are Immigrants from France (2.9%, a difference of 0.010%), Palestinian (2.9%, a difference of 0.070%), Sudanese (2.9%, a difference of 0.11%), Immigrants from Lebanon (2.9%, a difference of 0.18%), and Costa Rican (2.9%, a difference of 0.19%).
| Demographics | Rating | Rank | Hearing Disability |
| Immigrants | Congo | 78.9 /100 | #145 | Good 2.9% |
| Brazilians | 78.7 /100 | #146 | Good 2.9% |
| Tongans | 78.6 /100 | #147 | Good 2.9% |
| Immigrants | Russia | 77.7 /100 | #148 | Good 2.9% |
| Immigrants | Panama | 76.9 /100 | #149 | Good 2.9% |
| Palestinians | 73.6 /100 | #150 | Good 2.9% |
| Immigrants | France | 73.1 /100 | #151 | Good 2.9% |
| Immigrants | Lithuania | 73.0 /100 | #152 | Good 2.9% |
| Sudanese | 72.1 /100 | #153 | Good 2.9% |
| Immigrants | Lebanon | 71.5 /100 | #154 | Good 2.9% |
| Costa Ricans | 71.4 /100 | #155 | Good 2.9% |
| Immigrants | Poland | 70.2 /100 | #156 | Good 2.9% |
| Immigrants | Kazakhstan | 69.6 /100 | #157 | Good 2.9% |
| Immigrants | Burma/Myanmar | 69.5 /100 | #158 | Good 2.9% |
| Immigrants | Australia | 67.4 /100 | #159 | Good 2.9% |