Okinawan vs Immigrants from Lithuania Hearing Disability
COMPARE
Okinawan
Immigrants from Lithuania
Hearing Disability
Hearing Disability Comparison
Okinawans
Immigrants from Lithuania
2.6%
HEARING DISABILITY
99.6/ 100
METRIC RATING
36th/ 347
METRIC RANK
2.9%
HEARING DISABILITY
73.0/ 100
METRIC RATING
152nd/ 347
METRIC RANK
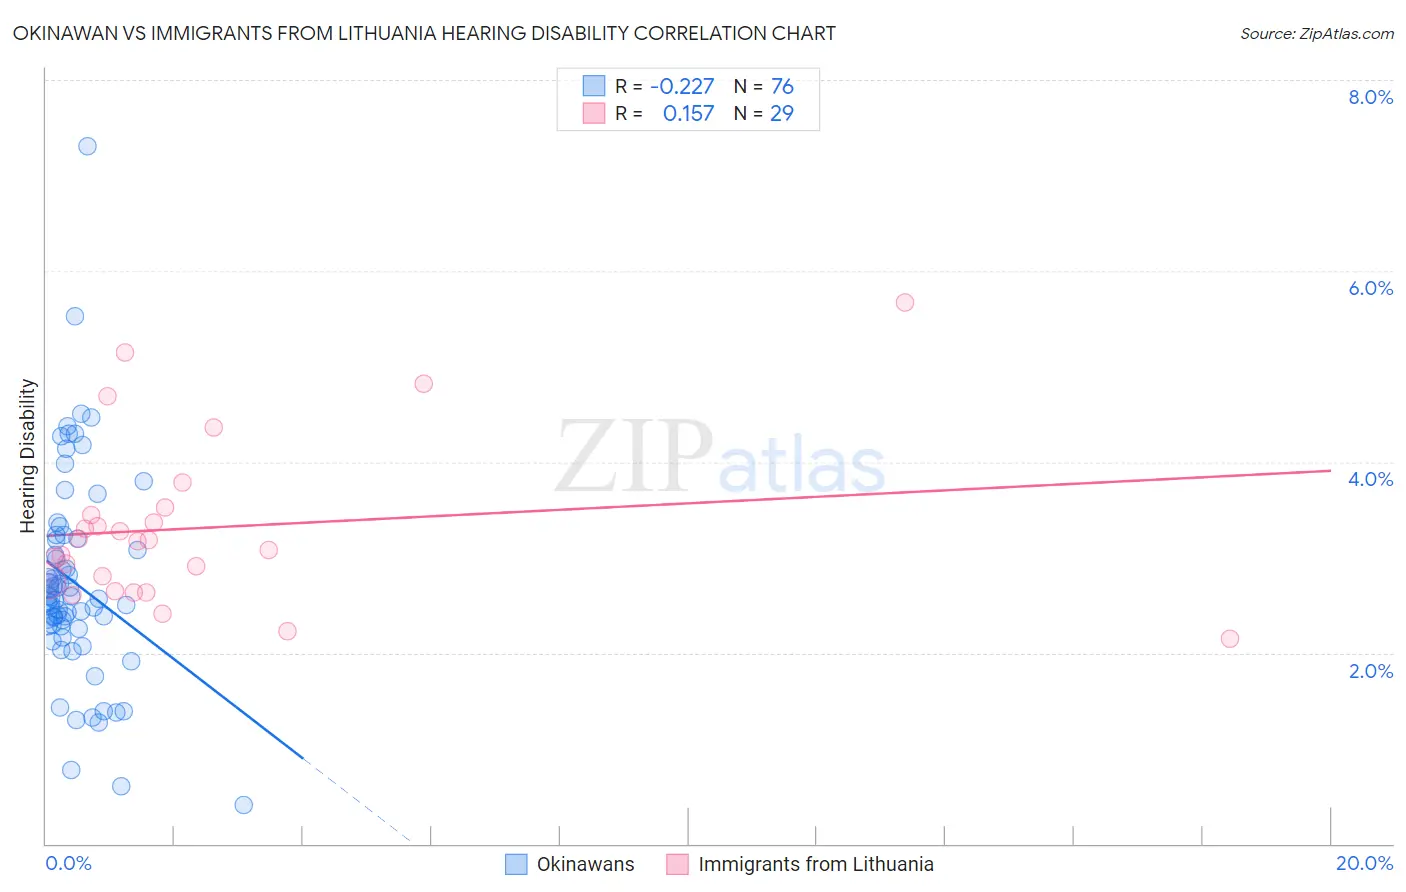
Okinawan vs Immigrants from Lithuania Hearing Disability Correlation Chart
The statistical analysis conducted on geographies consisting of 73,759,317 people shows a weak negative correlation between the proportion of Okinawans and percentage of population with hearing disability in the United States with a correlation coefficient (R) of -0.227 and weighted average of 2.6%. Similarly, the statistical analysis conducted on geographies consisting of 117,714,489 people shows a poor positive correlation between the proportion of Immigrants from Lithuania and percentage of population with hearing disability in the United States with a correlation coefficient (R) of 0.157 and weighted average of 2.9%, a difference of 11.9%.
Hearing Disability Correlation Summary
| Measurement | Okinawan | Immigrants from Lithuania |
| Minimum | 0.40% | 2.1% |
| Maximum | 7.3% | 5.7% |
| Range | 6.9% | 3.5% |
| Mean | 2.7% | 3.3% |
| Median | 2.6% | 3.2% |
| Interquartile 25% (IQ1) | 2.3% | 2.7% |
| Interquartile 75% (IQ3) | 3.2% | 3.5% |
| Interquartile Range (IQR) | 0.90% | 0.78% |
| Standard Deviation (Sample) | 1.1% | 0.86% |
| Standard Deviation (Population) | 1.1% | 0.85% |
Similar Demographics by Hearing Disability
Demographics Similar to Okinawans by Hearing Disability
In terms of hearing disability, the demographic groups most similar to Okinawans are Immigrants from Western Africa (2.6%, a difference of 0.020%), Immigrants from Jamaica (2.6%, a difference of 0.11%), Salvadoran (2.6%, a difference of 0.22%), Immigrants from Pakistan (2.6%, a difference of 0.35%), and Immigrants from China (2.6%, a difference of 0.35%).
| Demographics | Rating | Rank | Hearing Disability |
| Bolivians | 99.7 /100 | #29 | Exceptional 2.6% |
| Immigrants | Caribbean | 99.7 /100 | #30 | Exceptional 2.6% |
| Immigrants | Cameroon | 99.7 /100 | #31 | Exceptional 2.6% |
| Immigrants | Venezuela | 99.7 /100 | #32 | Exceptional 2.6% |
| Filipinos | 99.6 /100 | #33 | Exceptional 2.6% |
| Immigrants | Pakistan | 99.6 /100 | #34 | Exceptional 2.6% |
| Salvadorans | 99.6 /100 | #35 | Exceptional 2.6% |
| Okinawans | 99.6 /100 | #36 | Exceptional 2.6% |
| Immigrants | Western Africa | 99.6 /100 | #37 | Exceptional 2.6% |
| Immigrants | Jamaica | 99.5 /100 | #38 | Exceptional 2.6% |
| Immigrants | China | 99.5 /100 | #39 | Exceptional 2.6% |
| Haitians | 99.5 /100 | #40 | Exceptional 2.6% |
| Immigrants | Taiwan | 99.4 /100 | #41 | Exceptional 2.6% |
| West Indians | 99.4 /100 | #42 | Exceptional 2.6% |
| Senegalese | 99.4 /100 | #43 | Exceptional 2.6% |
Demographics Similar to Immigrants from Lithuania by Hearing Disability
In terms of hearing disability, the demographic groups most similar to Immigrants from Lithuania are Immigrants from France (2.9%, a difference of 0.010%), Palestinian (2.9%, a difference of 0.070%), Sudanese (2.9%, a difference of 0.11%), Immigrants from Lebanon (2.9%, a difference of 0.18%), and Costa Rican (2.9%, a difference of 0.19%).
| Demographics | Rating | Rank | Hearing Disability |
| Immigrants | Congo | 78.9 /100 | #145 | Good 2.9% |
| Brazilians | 78.7 /100 | #146 | Good 2.9% |
| Tongans | 78.6 /100 | #147 | Good 2.9% |
| Immigrants | Russia | 77.7 /100 | #148 | Good 2.9% |
| Immigrants | Panama | 76.9 /100 | #149 | Good 2.9% |
| Palestinians | 73.6 /100 | #150 | Good 2.9% |
| Immigrants | France | 73.1 /100 | #151 | Good 2.9% |
| Immigrants | Lithuania | 73.0 /100 | #152 | Good 2.9% |
| Sudanese | 72.1 /100 | #153 | Good 2.9% |
| Immigrants | Lebanon | 71.5 /100 | #154 | Good 2.9% |
| Costa Ricans | 71.4 /100 | #155 | Good 2.9% |
| Immigrants | Poland | 70.2 /100 | #156 | Good 2.9% |
| Immigrants | Kazakhstan | 69.6 /100 | #157 | Good 2.9% |
| Immigrants | Burma/Myanmar | 69.5 /100 | #158 | Good 2.9% |
| Immigrants | Australia | 67.4 /100 | #159 | Good 2.9% |