Jamaican vs Immigrants from Lithuania 8th Grade
COMPARE
Jamaican
Immigrants from Lithuania
8th Grade
8th Grade Comparison
Jamaicans
Immigrants from Lithuania
95.1%
8TH GRADE
1.4/ 100
METRIC RATING
245th/ 347
METRIC RANK
96.6%
8TH GRADE
99.6/ 100
METRIC RATING
70th/ 347
METRIC RANK
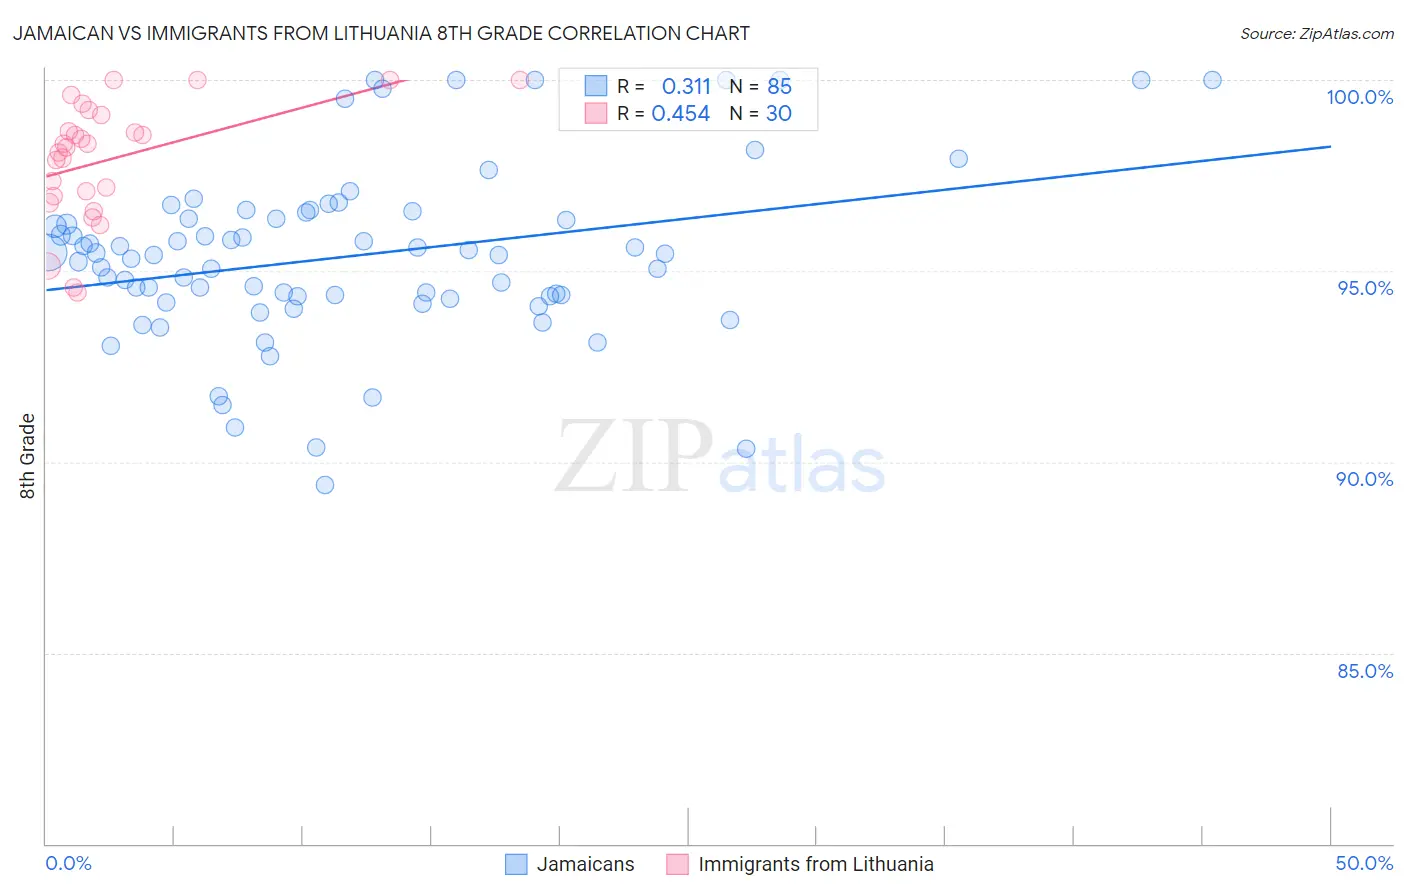
Jamaican vs Immigrants from Lithuania 8th Grade Correlation Chart
The statistical analysis conducted on geographies consisting of 368,084,732 people shows a mild positive correlation between the proportion of Jamaicans and percentage of population with at least 8th grade education in the United States with a correlation coefficient (R) of 0.311 and weighted average of 95.1%. Similarly, the statistical analysis conducted on geographies consisting of 117,724,932 people shows a moderate positive correlation between the proportion of Immigrants from Lithuania and percentage of population with at least 8th grade education in the United States with a correlation coefficient (R) of 0.454 and weighted average of 96.6%, a difference of 1.6%.
8th Grade Correlation Summary
| Measurement | Jamaican | Immigrants from Lithuania |
| Minimum | 89.4% | 94.4% |
| Maximum | 100.0% | 100.0% |
| Range | 10.6% | 5.6% |
| Mean | 95.4% | 97.9% |
| Median | 95.4% | 98.3% |
| Interquartile 25% (IQ1) | 94.3% | 97.0% |
| Interquartile 75% (IQ3) | 96.5% | 99.1% |
| Interquartile Range (IQR) | 2.2% | 2.1% |
| Standard Deviation (Sample) | 2.3% | 1.6% |
| Standard Deviation (Population) | 2.3% | 1.5% |
Similar Demographics by 8th Grade
Demographics Similar to Jamaicans by 8th Grade
In terms of 8th grade, the demographic groups most similar to Jamaicans are Somali (95.1%, a difference of 0.010%), Immigrants from Senegal (95.1%, a difference of 0.010%), Uruguayan (95.1%, a difference of 0.020%), Tongan (95.1%, a difference of 0.030%), and Paiute (95.1%, a difference of 0.030%).
| Demographics | Rating | Rank | 8th Grade |
| Natives/Alaskans | 2.3 /100 | #238 | Tragic 95.2% |
| Immigrants | Sierra Leone | 2.1 /100 | #239 | Tragic 95.1% |
| Ethiopians | 2.0 /100 | #240 | Tragic 95.1% |
| South American Indians | 1.9 /100 | #241 | Tragic 95.1% |
| Tongans | 1.7 /100 | #242 | Tragic 95.1% |
| Paiute | 1.7 /100 | #243 | Tragic 95.1% |
| Immigrants | Middle Africa | 1.7 /100 | #244 | Tragic 95.1% |
| Jamaicans | 1.4 /100 | #245 | Tragic 95.1% |
| Somalis | 1.4 /100 | #246 | Tragic 95.1% |
| Immigrants | Senegal | 1.4 /100 | #247 | Tragic 95.1% |
| Uruguayans | 1.2 /100 | #248 | Tragic 95.1% |
| Immigrants | China | 1.1 /100 | #249 | Tragic 95.0% |
| Koreans | 1.1 /100 | #250 | Tragic 95.0% |
| Bolivians | 1.0 /100 | #251 | Tragic 95.0% |
| Immigrants | Ethiopia | 1.0 /100 | #252 | Tragic 95.0% |
Demographics Similar to Immigrants from Lithuania by 8th Grade
In terms of 8th grade, the demographic groups most similar to Immigrants from Lithuania are American (96.6%, a difference of 0.020%), Creek (96.6%, a difference of 0.030%), Iranian (96.6%, a difference of 0.040%), Ukrainian (96.7%, a difference of 0.050%), and Immigrants from India (96.6%, a difference of 0.050%).
| Demographics | Rating | Rank | 8th Grade |
| Ukrainians | 99.7 /100 | #63 | Exceptional 96.7% |
| Immigrants | India | 99.7 /100 | #64 | Exceptional 96.6% |
| Native Hawaiians | 99.7 /100 | #65 | Exceptional 96.6% |
| Canadians | 99.7 /100 | #66 | Exceptional 96.6% |
| Iranians | 99.7 /100 | #67 | Exceptional 96.6% |
| Creek | 99.7 /100 | #68 | Exceptional 96.6% |
| Americans | 99.7 /100 | #69 | Exceptional 96.6% |
| Immigrants | Lithuania | 99.6 /100 | #70 | Exceptional 96.6% |
| New Zealanders | 99.5 /100 | #71 | Exceptional 96.6% |
| Immigrants | England | 99.5 /100 | #72 | Exceptional 96.6% |
| Arapaho | 99.5 /100 | #73 | Exceptional 96.6% |
| Immigrants | Ireland | 99.5 /100 | #74 | Exceptional 96.5% |
| Zimbabweans | 99.4 /100 | #75 | Exceptional 96.5% |
| Immigrants | Netherlands | 99.4 /100 | #76 | Exceptional 96.5% |
| Cypriots | 99.4 /100 | #77 | Exceptional 96.5% |