Jamaican vs Immigrants from Germany Hearing Disability
COMPARE
Jamaican
Immigrants from Germany
Hearing Disability
Hearing Disability Comparison
Jamaicans
Immigrants from Germany
2.7%
HEARING DISABILITY
99.0/ 100
METRIC RATING
52nd/ 347
METRIC RANK
3.5%
HEARING DISABILITY
0.1/ 100
METRIC RATING
264th/ 347
METRIC RANK
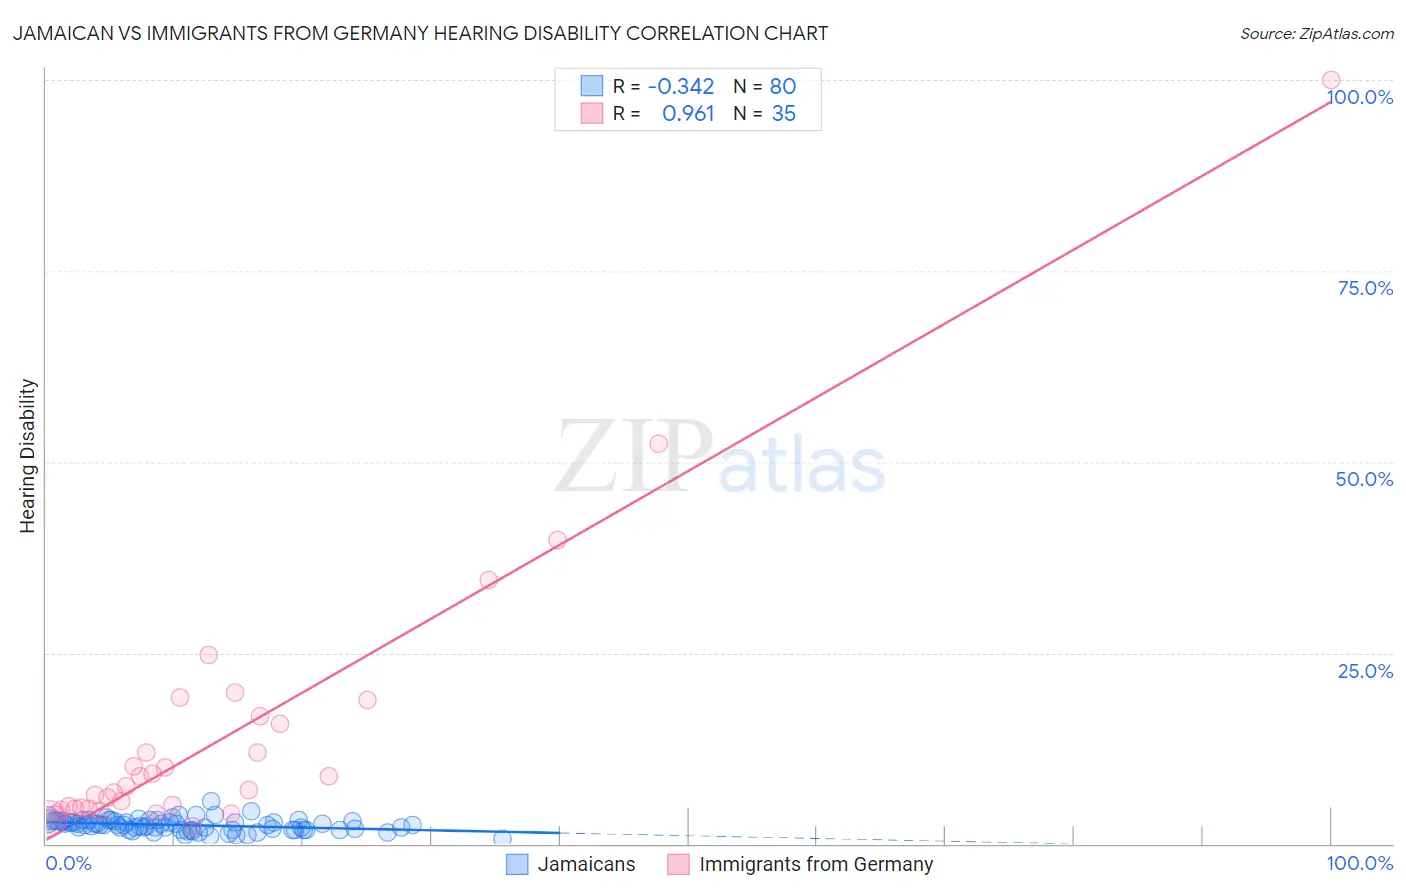
Jamaican vs Immigrants from Germany Hearing Disability Correlation Chart
The statistical analysis conducted on geographies consisting of 367,784,846 people shows a mild negative correlation between the proportion of Jamaicans and percentage of population with hearing disability in the United States with a correlation coefficient (R) of -0.342 and weighted average of 2.7%. Similarly, the statistical analysis conducted on geographies consisting of 463,741,390 people shows a perfect positive correlation between the proportion of Immigrants from Germany and percentage of population with hearing disability in the United States with a correlation coefficient (R) of 0.961 and weighted average of 3.5%, a difference of 30.1%.
Hearing Disability Correlation Summary
| Measurement | Jamaican | Immigrants from Germany |
| Minimum | 0.58% | 2.3% |
| Maximum | 5.6% | 100.0% |
| Range | 5.0% | 97.7% |
| Mean | 2.5% | 14.3% |
| Median | 2.5% | 7.5% |
| Interquartile 25% (IQ1) | 1.9% | 4.6% |
| Interquartile 75% (IQ3) | 3.0% | 16.7% |
| Interquartile Range (IQR) | 1.1% | 12.1% |
| Standard Deviation (Sample) | 0.80% | 18.6% |
| Standard Deviation (Population) | 0.80% | 18.3% |
Similar Demographics by Hearing Disability
Demographics Similar to Jamaicans by Hearing Disability
In terms of hearing disability, the demographic groups most similar to Jamaicans are Immigrants from Eastern Asia (2.7%, a difference of 0.070%), Ethiopian (2.7%, a difference of 0.10%), Immigrants from Ethiopia (2.7%, a difference of 0.16%), Immigrants from Nicaragua (2.7%, a difference of 0.19%), and South American (2.7%, a difference of 0.23%).
| Demographics | Rating | Rank | Hearing Disability |
| Venezuelans | 99.4 /100 | #45 | Exceptional 2.6% |
| Immigrants | Dominica | 99.3 /100 | #46 | Exceptional 2.6% |
| Immigrants | Israel | 99.3 /100 | #47 | Exceptional 2.6% |
| Immigrants | Singapore | 99.3 /100 | #48 | Exceptional 2.6% |
| Immigrants | South America | 99.2 /100 | #49 | Exceptional 2.7% |
| Paraguayans | 99.2 /100 | #50 | Exceptional 2.7% |
| Immigrants | Hong Kong | 99.2 /100 | #51 | Exceptional 2.7% |
| Jamaicans | 99.0 /100 | #52 | Exceptional 2.7% |
| Immigrants | Eastern Asia | 99.0 /100 | #53 | Exceptional 2.7% |
| Ethiopians | 99.0 /100 | #54 | Exceptional 2.7% |
| Immigrants | Ethiopia | 99.0 /100 | #55 | Exceptional 2.7% |
| Immigrants | Nicaragua | 99.0 /100 | #56 | Exceptional 2.7% |
| South Americans | 99.0 /100 | #57 | Exceptional 2.7% |
| Immigrants | Peru | 98.6 /100 | #58 | Exceptional 2.7% |
| Immigrants | Eritrea | 98.5 /100 | #59 | Exceptional 2.7% |
Demographics Similar to Immigrants from Germany by Hearing Disability
In terms of hearing disability, the demographic groups most similar to Immigrants from Germany are British (3.5%, a difference of 0.020%), Belgian (3.5%, a difference of 0.20%), Immigrants from Canada (3.5%, a difference of 0.22%), Immigrants from North America (3.5%, a difference of 0.26%), and Hawaiian (3.5%, a difference of 0.38%).
| Demographics | Rating | Rank | Hearing Disability |
| Yaqui | 0.2 /100 | #257 | Tragic 3.4% |
| Northern Europeans | 0.2 /100 | #258 | Tragic 3.4% |
| Slovenes | 0.1 /100 | #259 | Tragic 3.5% |
| Portuguese | 0.1 /100 | #260 | Tragic 3.5% |
| Hawaiians | 0.1 /100 | #261 | Tragic 3.5% |
| Immigrants | North America | 0.1 /100 | #262 | Tragic 3.5% |
| Immigrants | Canada | 0.1 /100 | #263 | Tragic 3.5% |
| Immigrants | Germany | 0.1 /100 | #264 | Tragic 3.5% |
| British | 0.1 /100 | #265 | Tragic 3.5% |
| Belgians | 0.1 /100 | #266 | Tragic 3.5% |
| Canadians | 0.1 /100 | #267 | Tragic 3.5% |
| Spaniards | 0.1 /100 | #268 | Tragic 3.5% |
| Ute | 0.1 /100 | #269 | Tragic 3.5% |
| Europeans | 0.1 /100 | #270 | Tragic 3.5% |
| Czechs | 0.1 /100 | #271 | Tragic 3.5% |