Jamaican vs Immigrants Hearing Disability
COMPARE
Jamaican
Immigrants
Hearing Disability
Hearing Disability Comparison
Jamaicans
Immigrants
2.7%
HEARING DISABILITY
99.0/ 100
METRIC RATING
52nd/ 347
METRIC RANK
2.8%
HEARING DISABILITY
90.3/ 100
METRIC RATING
116th/ 347
METRIC RANK
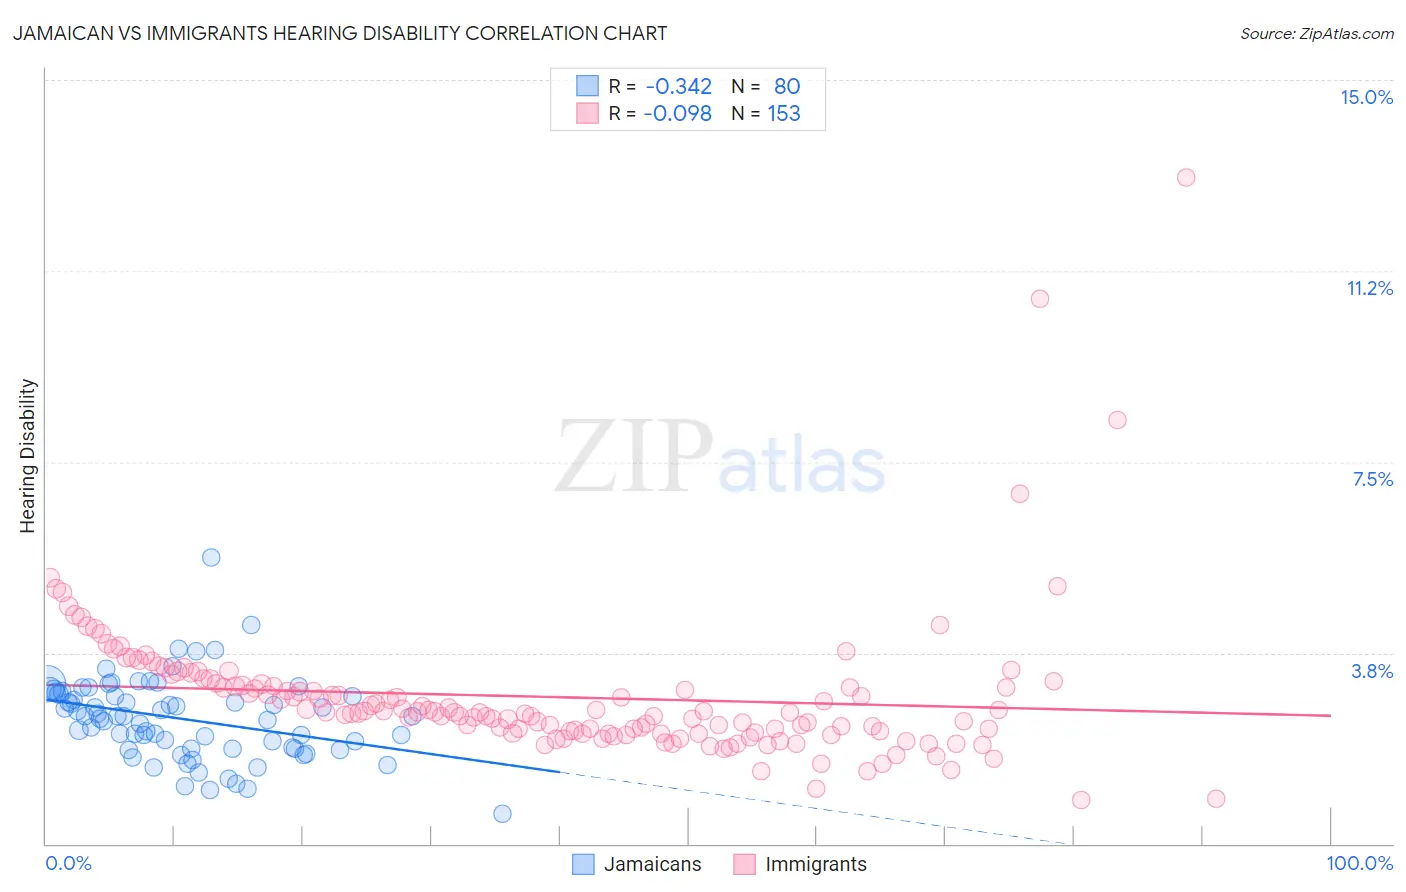
Jamaican vs Immigrants Hearing Disability Correlation Chart
The statistical analysis conducted on geographies consisting of 367,784,846 people shows a mild negative correlation between the proportion of Jamaicans and percentage of population with hearing disability in the United States with a correlation coefficient (R) of -0.342 and weighted average of 2.7%. Similarly, the statistical analysis conducted on geographies consisting of 576,876,891 people shows a slight negative correlation between the proportion of Immigrants and percentage of population with hearing disability in the United States with a correlation coefficient (R) of -0.098 and weighted average of 2.8%, a difference of 6.3%.
Hearing Disability Correlation Summary
| Measurement | Jamaican | Immigrants |
| Minimum | 0.58% | 0.87% |
| Maximum | 5.6% | 13.1% |
| Range | 5.0% | 12.2% |
| Mean | 2.5% | 2.9% |
| Median | 2.5% | 2.6% |
| Interquartile 25% (IQ1) | 1.9% | 2.2% |
| Interquartile 75% (IQ3) | 3.0% | 3.1% |
| Interquartile Range (IQR) | 1.1% | 0.95% |
| Standard Deviation (Sample) | 0.80% | 1.4% |
| Standard Deviation (Population) | 0.80% | 1.4% |
Similar Demographics by Hearing Disability
Demographics Similar to Jamaicans by Hearing Disability
In terms of hearing disability, the demographic groups most similar to Jamaicans are Immigrants from Eastern Asia (2.7%, a difference of 0.070%), Ethiopian (2.7%, a difference of 0.10%), Immigrants from Ethiopia (2.7%, a difference of 0.16%), Immigrants from Nicaragua (2.7%, a difference of 0.19%), and South American (2.7%, a difference of 0.23%).
| Demographics | Rating | Rank | Hearing Disability |
| Venezuelans | 99.4 /100 | #45 | Exceptional 2.6% |
| Immigrants | Dominica | 99.3 /100 | #46 | Exceptional 2.6% |
| Immigrants | Israel | 99.3 /100 | #47 | Exceptional 2.6% |
| Immigrants | Singapore | 99.3 /100 | #48 | Exceptional 2.6% |
| Immigrants | South America | 99.2 /100 | #49 | Exceptional 2.7% |
| Paraguayans | 99.2 /100 | #50 | Exceptional 2.7% |
| Immigrants | Hong Kong | 99.2 /100 | #51 | Exceptional 2.7% |
| Jamaicans | 99.0 /100 | #52 | Exceptional 2.7% |
| Immigrants | Eastern Asia | 99.0 /100 | #53 | Exceptional 2.7% |
| Ethiopians | 99.0 /100 | #54 | Exceptional 2.7% |
| Immigrants | Ethiopia | 99.0 /100 | #55 | Exceptional 2.7% |
| Immigrants | Nicaragua | 99.0 /100 | #56 | Exceptional 2.7% |
| South Americans | 99.0 /100 | #57 | Exceptional 2.7% |
| Immigrants | Peru | 98.6 /100 | #58 | Exceptional 2.7% |
| Immigrants | Eritrea | 98.5 /100 | #59 | Exceptional 2.7% |
Demographics Similar to Immigrants by Hearing Disability
In terms of hearing disability, the demographic groups most similar to Immigrants are Immigrants from Latin America (2.8%, a difference of 0.060%), Immigrants from Liberia (2.8%, a difference of 0.090%), Zimbabwean (2.8%, a difference of 0.10%), Kenyan (2.8%, a difference of 0.12%), and Jordanian (2.8%, a difference of 0.21%).
| Demographics | Rating | Rank | Hearing Disability |
| Turks | 93.0 /100 | #109 | Exceptional 2.8% |
| Cypriots | 92.9 /100 | #110 | Exceptional 2.8% |
| Immigrants | Yemen | 92.7 /100 | #111 | Exceptional 2.8% |
| U.S. Virgin Islanders | 92.5 /100 | #112 | Exceptional 2.8% |
| Immigrants | Belarus | 91.6 /100 | #113 | Exceptional 2.8% |
| Cambodians | 91.1 /100 | #114 | Exceptional 2.8% |
| Immigrants | Latin America | 90.5 /100 | #115 | Exceptional 2.8% |
| Immigrants | Immigrants | 90.3 /100 | #116 | Exceptional 2.8% |
| Immigrants | Liberia | 90.0 /100 | #117 | Excellent 2.8% |
| Zimbabweans | 89.9 /100 | #118 | Excellent 2.8% |
| Kenyans | 89.8 /100 | #119 | Excellent 2.8% |
| Jordanians | 89.5 /100 | #120 | Excellent 2.8% |
| Cubans | 89.4 /100 | #121 | Excellent 2.8% |
| Liberians | 89.0 /100 | #122 | Excellent 2.8% |
| Immigrants | Zaire | 88.6 /100 | #123 | Excellent 2.9% |