Jamaican vs Tsimshian Hearing Disability
COMPARE
Jamaican
Tsimshian
Hearing Disability
Hearing Disability Comparison
Jamaicans
Tsimshian
2.7%
HEARING DISABILITY
99.0/ 100
METRIC RATING
52nd/ 347
METRIC RANK
4.7%
HEARING DISABILITY
0.0/ 100
METRIC RATING
342nd/ 347
METRIC RANK
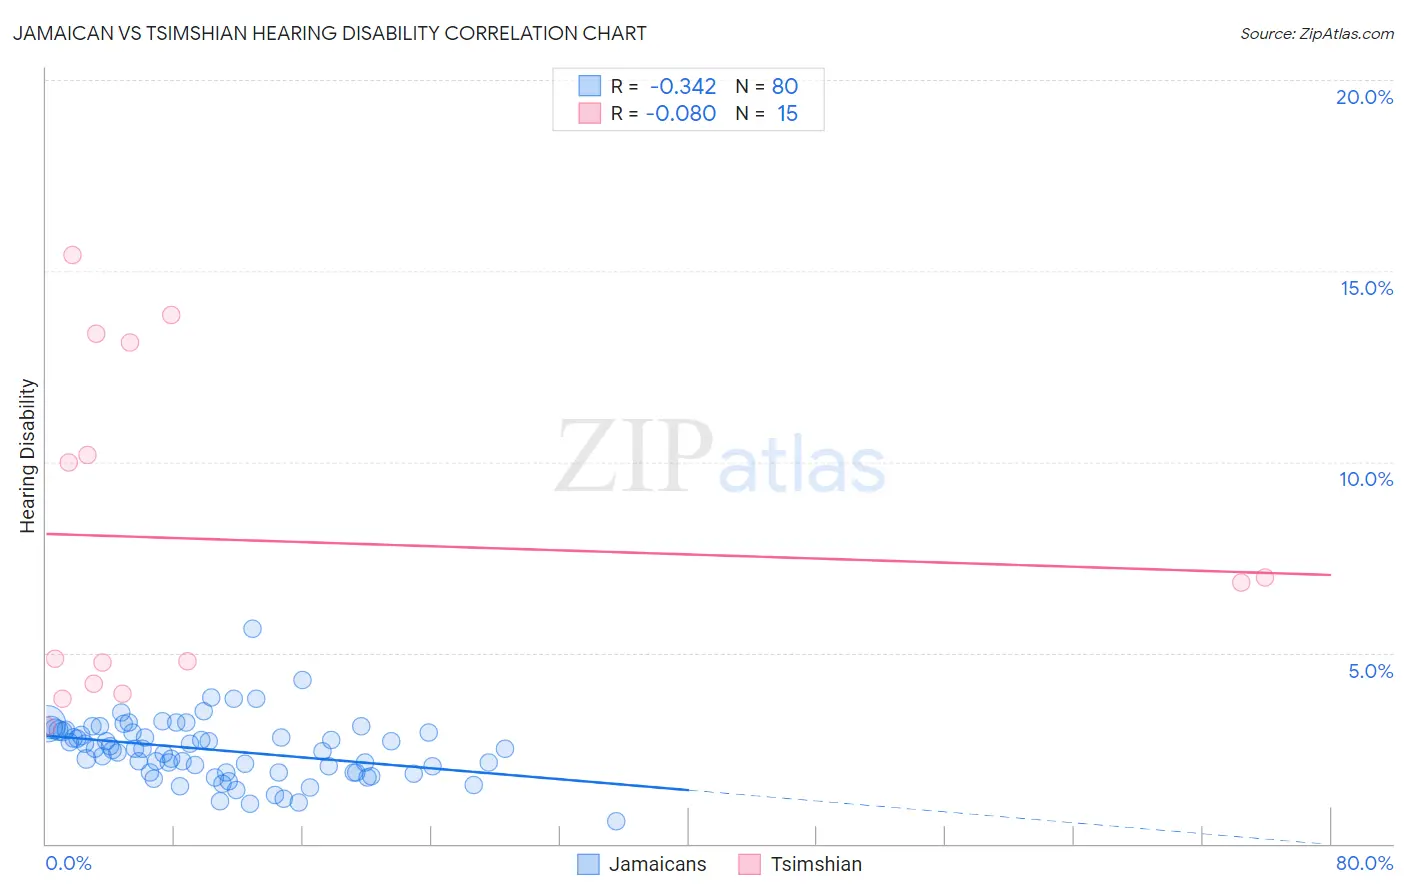
Jamaican vs Tsimshian Hearing Disability Correlation Chart
The statistical analysis conducted on geographies consisting of 367,784,846 people shows a mild negative correlation between the proportion of Jamaicans and percentage of population with hearing disability in the United States with a correlation coefficient (R) of -0.342 and weighted average of 2.7%. Similarly, the statistical analysis conducted on geographies consisting of 15,626,462 people shows a slight negative correlation between the proportion of Tsimshian and percentage of population with hearing disability in the United States with a correlation coefficient (R) of -0.080 and weighted average of 4.7%, a difference of 76.2%.
Hearing Disability Correlation Summary
| Measurement | Jamaican | Tsimshian |
| Minimum | 0.58% | 3.1% |
| Maximum | 5.6% | 15.4% |
| Range | 5.0% | 12.3% |
| Mean | 2.5% | 7.9% |
| Median | 2.5% | 6.8% |
| Interquartile 25% (IQ1) | 1.9% | 4.2% |
| Interquartile 75% (IQ3) | 3.0% | 13.1% |
| Interquartile Range (IQR) | 1.1% | 8.9% |
| Standard Deviation (Sample) | 0.80% | 4.3% |
| Standard Deviation (Population) | 0.80% | 4.2% |
Similar Demographics by Hearing Disability
Demographics Similar to Jamaicans by Hearing Disability
In terms of hearing disability, the demographic groups most similar to Jamaicans are Immigrants from Eastern Asia (2.7%, a difference of 0.070%), Ethiopian (2.7%, a difference of 0.10%), Immigrants from Ethiopia (2.7%, a difference of 0.16%), Immigrants from Nicaragua (2.7%, a difference of 0.19%), and South American (2.7%, a difference of 0.23%).
| Demographics | Rating | Rank | Hearing Disability |
| Venezuelans | 99.4 /100 | #45 | Exceptional 2.6% |
| Immigrants | Dominica | 99.3 /100 | #46 | Exceptional 2.6% |
| Immigrants | Israel | 99.3 /100 | #47 | Exceptional 2.6% |
| Immigrants | Singapore | 99.3 /100 | #48 | Exceptional 2.6% |
| Immigrants | South America | 99.2 /100 | #49 | Exceptional 2.7% |
| Paraguayans | 99.2 /100 | #50 | Exceptional 2.7% |
| Immigrants | Hong Kong | 99.2 /100 | #51 | Exceptional 2.7% |
| Jamaicans | 99.0 /100 | #52 | Exceptional 2.7% |
| Immigrants | Eastern Asia | 99.0 /100 | #53 | Exceptional 2.7% |
| Ethiopians | 99.0 /100 | #54 | Exceptional 2.7% |
| Immigrants | Ethiopia | 99.0 /100 | #55 | Exceptional 2.7% |
| Immigrants | Nicaragua | 99.0 /100 | #56 | Exceptional 2.7% |
| South Americans | 99.0 /100 | #57 | Exceptional 2.7% |
| Immigrants | Peru | 98.6 /100 | #58 | Exceptional 2.7% |
| Immigrants | Eritrea | 98.5 /100 | #59 | Exceptional 2.7% |
Demographics Similar to Tsimshian by Hearing Disability
In terms of hearing disability, the demographic groups most similar to Tsimshian are Inupiat (4.7%, a difference of 0.21%), Navajo (4.6%, a difference of 1.5%), Pueblo (4.6%, a difference of 1.9%), Tlingit-Haida (4.8%, a difference of 2.9%), and Choctaw (4.5%, a difference of 3.4%).
| Demographics | Rating | Rank | Hearing Disability |
| Dutch West Indians | 0.0 /100 | #333 | Tragic 4.3% |
| Aleuts | 0.0 /100 | #334 | Tragic 4.3% |
| Kiowa | 0.0 /100 | #335 | Tragic 4.3% |
| Creek | 0.0 /100 | #336 | Tragic 4.4% |
| Chickasaw | 0.0 /100 | #337 | Tragic 4.5% |
| Alaska Natives | 0.0 /100 | #338 | Tragic 4.5% |
| Choctaw | 0.0 /100 | #339 | Tragic 4.5% |
| Pueblo | 0.0 /100 | #340 | Tragic 4.6% |
| Navajo | 0.0 /100 | #341 | Tragic 4.6% |
| Tsimshian | 0.0 /100 | #342 | Tragic 4.7% |
| Inupiat | 0.0 /100 | #343 | Tragic 4.7% |
| Tlingit-Haida | 0.0 /100 | #344 | Tragic 4.8% |
| Alaskan Athabascans | 0.0 /100 | #345 | Tragic 5.3% |
| Colville | 0.0 /100 | #346 | Tragic 5.3% |
| Yup'ik | 0.0 /100 | #347 | Tragic 5.8% |