Jamaican vs Immigrants from Lithuania Per Capita Income
COMPARE
Jamaican
Immigrants from Lithuania
Per Capita Income
Per Capita Income Comparison
Jamaicans
Immigrants from Lithuania
$39,231
PER CAPITA INCOME
0.7/ 100
METRIC RATING
258th/ 347
METRIC RANK
$51,361
PER CAPITA INCOME
100.0/ 100
METRIC RATING
43rd/ 347
METRIC RANK
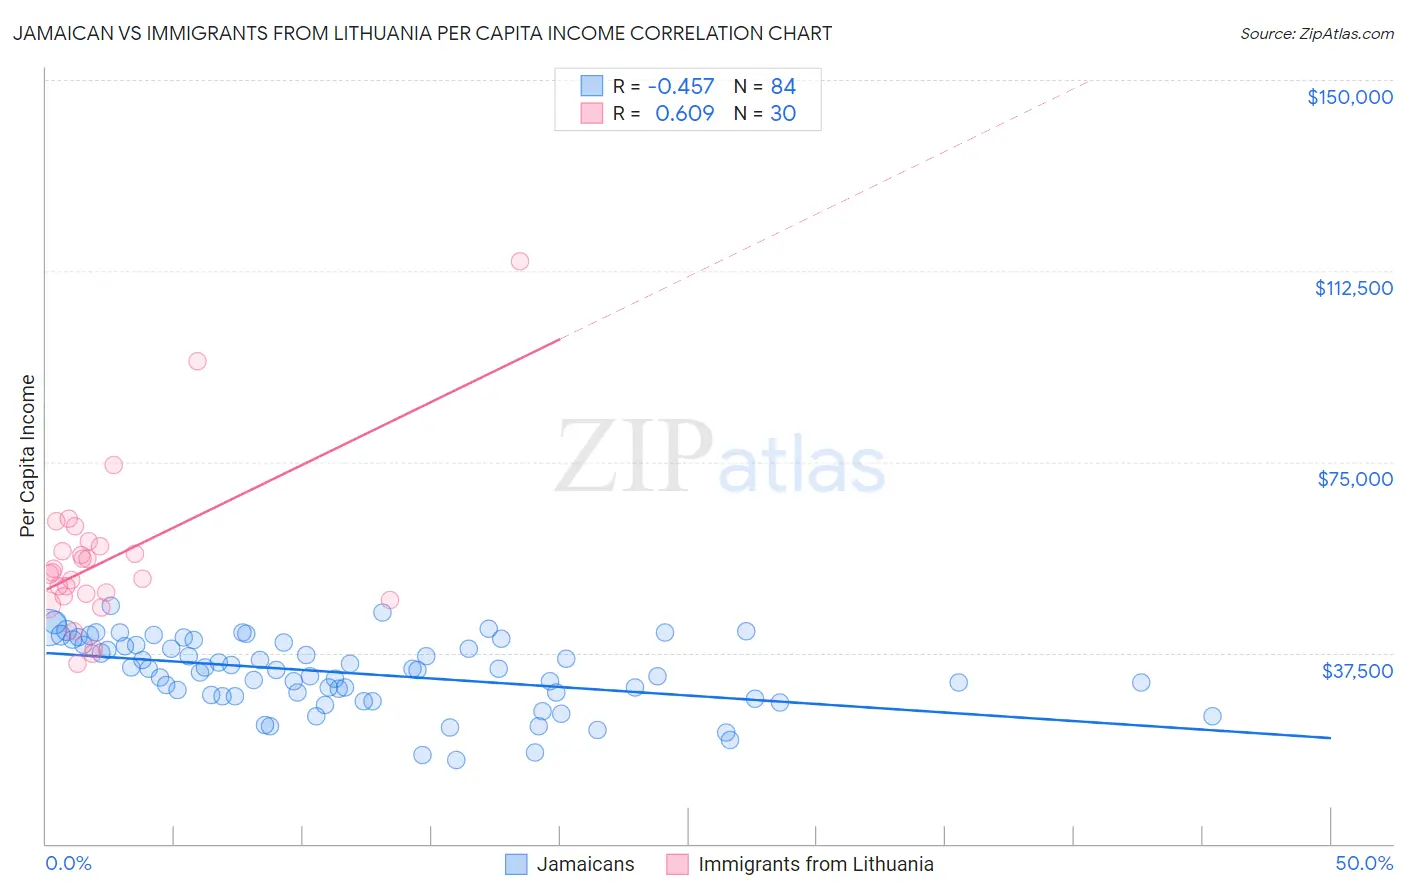
Jamaican vs Immigrants from Lithuania Per Capita Income Correlation Chart
The statistical analysis conducted on geographies consisting of 368,110,686 people shows a moderate negative correlation between the proportion of Jamaicans and per capita income in the United States with a correlation coefficient (R) of -0.457 and weighted average of $39,231. Similarly, the statistical analysis conducted on geographies consisting of 117,724,932 people shows a significant positive correlation between the proportion of Immigrants from Lithuania and per capita income in the United States with a correlation coefficient (R) of 0.609 and weighted average of $51,361, a difference of 30.9%.
Per Capita Income Correlation Summary
| Measurement | Jamaican | Immigrants from Lithuania |
| Minimum | $16,350 | $35,413 |
| Maximum | $46,707 | $114,327 |
| Range | $30,357 | $78,914 |
| Mean | $33,502 | $56,005 |
| Median | $34,287 | $53,196 |
| Interquartile 25% (IQ1) | $29,169 | $48,580 |
| Interquartile 75% (IQ3) | $39,281 | $58,433 |
| Interquartile Range (IQR) | $10,112 | $9,853 |
| Standard Deviation (Sample) | $6,895 | $15,760 |
| Standard Deviation (Population) | $6,854 | $15,495 |
Similar Demographics by Per Capita Income
Demographics Similar to Jamaicans by Per Capita Income
In terms of per capita income, the demographic groups most similar to Jamaicans are Malaysian ($39,194, a difference of 0.090%), Alaskan Athabascan ($39,163, a difference of 0.17%), Marshallese ($39,108, a difference of 0.31%), Iroquois ($39,104, a difference of 0.33%), and Belizean ($39,097, a difference of 0.34%).
| Demographics | Rating | Rank | Per Capita Income |
| Samoans | 1.3 /100 | #251 | Tragic $39,826 |
| Immigrants | Azores | 1.0 /100 | #252 | Tragic $39,608 |
| Osage | 1.0 /100 | #253 | Tragic $39,568 |
| Alaska Natives | 1.0 /100 | #254 | Tragic $39,558 |
| Immigrants | Middle Africa | 1.0 /100 | #255 | Tragic $39,529 |
| Hawaiians | 0.8 /100 | #256 | Tragic $39,403 |
| Nicaraguans | 0.8 /100 | #257 | Tragic $39,372 |
| Jamaicans | 0.7 /100 | #258 | Tragic $39,231 |
| Malaysians | 0.7 /100 | #259 | Tragic $39,194 |
| Alaskan Athabascans | 0.6 /100 | #260 | Tragic $39,163 |
| Marshallese | 0.6 /100 | #261 | Tragic $39,108 |
| Iroquois | 0.6 /100 | #262 | Tragic $39,104 |
| Belizeans | 0.6 /100 | #263 | Tragic $39,097 |
| Americans | 0.6 /100 | #264 | Tragic $39,039 |
| Spanish Americans | 0.5 /100 | #265 | Tragic $39,012 |
Demographics Similar to Immigrants from Lithuania by Per Capita Income
In terms of per capita income, the demographic groups most similar to Immigrants from Lithuania are Immigrants from Turkey ($51,368, a difference of 0.010%), Immigrants from South Africa ($51,465, a difference of 0.20%), Immigrants from Korea ($51,671, a difference of 0.60%), Cambodian ($51,731, a difference of 0.72%), and Immigrants from Czechoslovakia ($51,770, a difference of 0.80%).
| Demographics | Rating | Rank | Per Capita Income |
| Immigrants | Greece | 100.0 /100 | #36 | Exceptional $51,891 |
| Estonians | 100.0 /100 | #37 | Exceptional $51,875 |
| Immigrants | Czechoslovakia | 100.0 /100 | #38 | Exceptional $51,770 |
| Cambodians | 100.0 /100 | #39 | Exceptional $51,731 |
| Immigrants | Korea | 100.0 /100 | #40 | Exceptional $51,671 |
| Immigrants | South Africa | 100.0 /100 | #41 | Exceptional $51,465 |
| Immigrants | Turkey | 100.0 /100 | #42 | Exceptional $51,368 |
| Immigrants | Lithuania | 100.0 /100 | #43 | Exceptional $51,361 |
| Immigrants | Europe | 100.0 /100 | #44 | Exceptional $50,950 |
| Immigrants | Spain | 100.0 /100 | #45 | Exceptional $50,933 |
| Immigrants | Latvia | 100.0 /100 | #46 | Exceptional $50,914 |
| Bulgarians | 100.0 /100 | #47 | Exceptional $50,906 |
| Immigrants | Serbia | 100.0 /100 | #48 | Exceptional $50,810 |
| New Zealanders | 100.0 /100 | #49 | Exceptional $50,575 |
| Immigrants | Sri Lanka | 100.0 /100 | #50 | Exceptional $50,555 |