Jamaican vs Immigrants from Lithuania Professional Degree
COMPARE
Jamaican
Immigrants from Lithuania
Professional Degree
Professional Degree Comparison
Jamaicans
Immigrants from Lithuania
3.7%
PROFESSIONAL DEGREE
1.4/ 100
METRIC RATING
252nd/ 347
METRIC RANK
5.6%
PROFESSIONAL DEGREE
99.9/ 100
METRIC RATING
61st/ 347
METRIC RANK
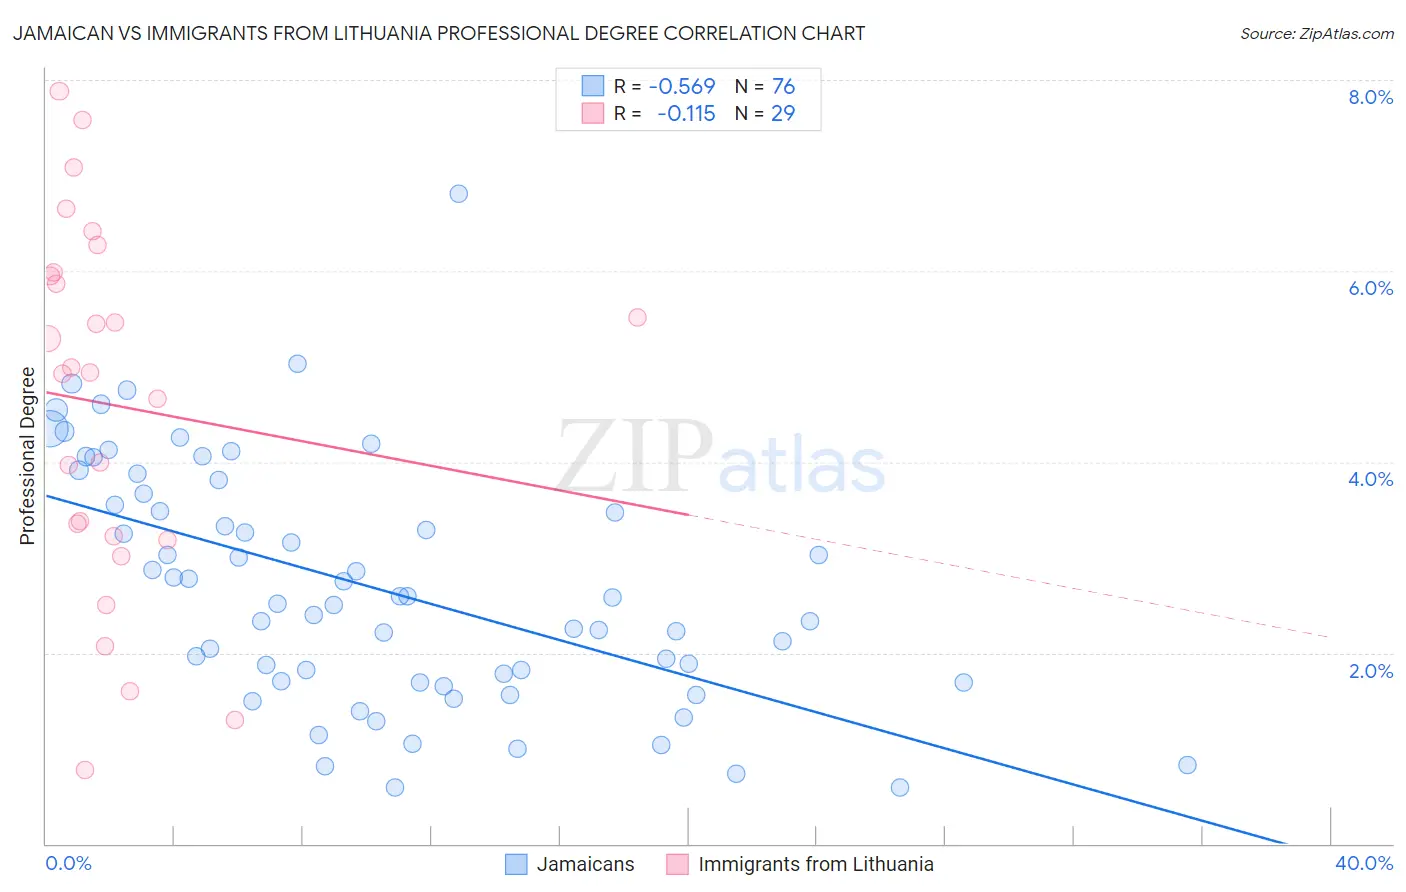
Jamaican vs Immigrants from Lithuania Professional Degree Correlation Chart
The statistical analysis conducted on geographies consisting of 367,101,955 people shows a substantial negative correlation between the proportion of Jamaicans and percentage of population with at least professional degree education in the United States with a correlation coefficient (R) of -0.569 and weighted average of 3.7%. Similarly, the statistical analysis conducted on geographies consisting of 117,699,727 people shows a poor negative correlation between the proportion of Immigrants from Lithuania and percentage of population with at least professional degree education in the United States with a correlation coefficient (R) of -0.115 and weighted average of 5.6%, a difference of 49.7%.
Professional Degree Correlation Summary
| Measurement | Jamaican | Immigrants from Lithuania |
| Minimum | 0.59% | 0.77% |
| Maximum | 6.8% | 7.9% |
| Range | 6.2% | 7.1% |
| Mean | 2.7% | 4.6% |
| Median | 2.5% | 4.9% |
| Interquartile 25% (IQ1) | 1.7% | 3.2% |
| Interquartile 75% (IQ3) | 3.6% | 6.0% |
| Interquartile Range (IQR) | 1.9% | 2.8% |
| Standard Deviation (Sample) | 1.3% | 1.9% |
| Standard Deviation (Population) | 1.3% | 1.9% |
Similar Demographics by Professional Degree
Demographics Similar to Jamaicans by Professional Degree
In terms of professional degree, the demographic groups most similar to Jamaicans are Pueblo (3.7%, a difference of 0.10%), Immigrants from Nicaragua (3.7%, a difference of 0.14%), Tongan (3.7%, a difference of 0.24%), Immigrants from Fiji (3.7%, a difference of 0.39%), and Immigrants from Grenada (3.7%, a difference of 0.46%).
| Demographics | Rating | Rank | Professional Degree |
| French American Indians | 1.7 /100 | #245 | Tragic 3.8% |
| Marshallese | 1.7 /100 | #246 | Tragic 3.8% |
| Guyanese | 1.6 /100 | #247 | Tragic 3.8% |
| Hmong | 1.6 /100 | #248 | Tragic 3.7% |
| Immigrants | Grenada | 1.5 /100 | #249 | Tragic 3.7% |
| Immigrants | Fiji | 1.5 /100 | #250 | Tragic 3.7% |
| Immigrants | Nicaragua | 1.4 /100 | #251 | Tragic 3.7% |
| Jamaicans | 1.4 /100 | #252 | Tragic 3.7% |
| Pueblo | 1.4 /100 | #253 | Tragic 3.7% |
| Tongans | 1.3 /100 | #254 | Tragic 3.7% |
| Osage | 1.2 /100 | #255 | Tragic 3.7% |
| Iroquois | 1.2 /100 | #256 | Tragic 3.7% |
| Bahamians | 1.1 /100 | #257 | Tragic 3.7% |
| Immigrants | St. Vincent and the Grenadines | 1.1 /100 | #258 | Tragic 3.7% |
| Africans | 1.0 /100 | #259 | Tragic 3.7% |
Demographics Similar to Immigrants from Lithuania by Professional Degree
In terms of professional degree, the demographic groups most similar to Immigrants from Lithuania are Bolivian (5.6%, a difference of 0.65%), Immigrants from Belarus (5.5%, a difference of 0.76%), Immigrants from Europe (5.6%, a difference of 1.1%), Asian (5.5%, a difference of 1.2%), and Immigrants from Asia (5.5%, a difference of 1.3%).
| Demographics | Rating | Rank | Professional Degree |
| Immigrants | Kuwait | 100.0 /100 | #54 | Exceptional 5.7% |
| Immigrants | Western Europe | 100.0 /100 | #55 | Exceptional 5.7% |
| Immigrants | Malaysia | 100.0 /100 | #56 | Exceptional 5.7% |
| South Africans | 100.0 /100 | #57 | Exceptional 5.7% |
| Bulgarians | 100.0 /100 | #58 | Exceptional 5.7% |
| Immigrants | Europe | 100.0 /100 | #59 | Exceptional 5.6% |
| Bolivians | 99.9 /100 | #60 | Exceptional 5.6% |
| Immigrants | Lithuania | 99.9 /100 | #61 | Exceptional 5.6% |
| Immigrants | Belarus | 99.9 /100 | #62 | Exceptional 5.5% |
| Asians | 99.9 /100 | #63 | Exceptional 5.5% |
| Immigrants | Asia | 99.9 /100 | #64 | Exceptional 5.5% |
| Immigrants | Bolivia | 99.9 /100 | #65 | Exceptional 5.5% |
| Immigrants | Kazakhstan | 99.9 /100 | #66 | Exceptional 5.5% |
| Immigrants | Bulgaria | 99.9 /100 | #67 | Exceptional 5.5% |
| Immigrants | Lebanon | 99.9 /100 | #68 | Exceptional 5.5% |