Jamaican vs Immigrants from Belize Male Disability
COMPARE
Jamaican
Immigrants from Belize
Male Disability
Male Disability Comparison
Jamaicans
Immigrants from Belize
11.5%
MALE DISABILITY
10.9/ 100
METRIC RATING
203rd/ 347
METRIC RANK
11.3%
MALE DISABILITY
33.7/ 100
METRIC RATING
182nd/ 347
METRIC RANK
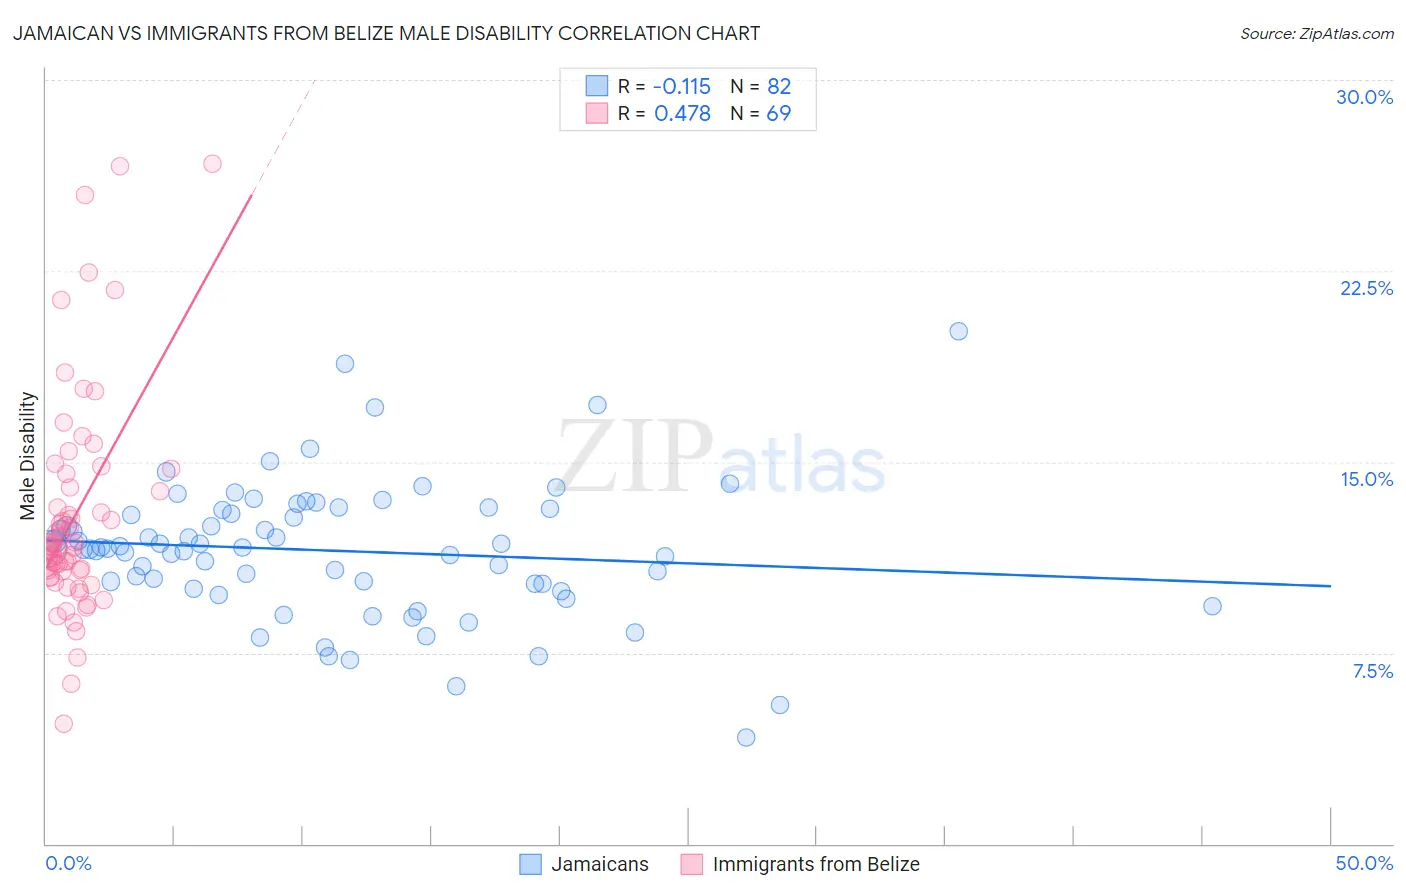
Jamaican vs Immigrants from Belize Male Disability Correlation Chart
The statistical analysis conducted on geographies consisting of 367,937,563 people shows a poor negative correlation between the proportion of Jamaicans and percentage of males with a disability in the United States with a correlation coefficient (R) of -0.115 and weighted average of 11.5%. Similarly, the statistical analysis conducted on geographies consisting of 130,304,028 people shows a moderate positive correlation between the proportion of Immigrants from Belize and percentage of males with a disability in the United States with a correlation coefficient (R) of 0.478 and weighted average of 11.3%, a difference of 2.0%.
Male Disability Correlation Summary
| Measurement | Jamaican | Immigrants from Belize |
| Minimum | 4.2% | 4.7% |
| Maximum | 20.1% | 26.7% |
| Range | 15.9% | 22.0% |
| Mean | 11.5% | 12.9% |
| Median | 11.6% | 11.7% |
| Interquartile 25% (IQ1) | 10.2% | 10.6% |
| Interquartile 75% (IQ3) | 13.1% | 14.3% |
| Interquartile Range (IQR) | 2.9% | 3.7% |
| Standard Deviation (Sample) | 2.7% | 4.3% |
| Standard Deviation (Population) | 2.7% | 4.3% |
Similar Demographics by Male Disability
Demographics Similar to Jamaicans by Male Disability
In terms of male disability, the demographic groups most similar to Jamaicans are Immigrants from Cambodia (11.5%, a difference of 0.010%), Serbian (11.5%, a difference of 0.020%), Ukrainian (11.5%, a difference of 0.030%), Immigrants from Somalia (11.5%, a difference of 0.060%), and Icelander (11.6%, a difference of 0.10%).
| Demographics | Rating | Rank | Male Disability |
| West Indians | 18.4 /100 | #196 | Poor 11.4% |
| Somalis | 18.2 /100 | #197 | Poor 11.4% |
| Immigrants | Jamaica | 16.3 /100 | #198 | Poor 11.5% |
| Lebanese | 15.4 /100 | #199 | Poor 11.5% |
| Immigrants | Iraq | 13.0 /100 | #200 | Poor 11.5% |
| Immigrants | Panama | 13.0 /100 | #201 | Poor 11.5% |
| Immigrants | Mexico | 12.6 /100 | #202 | Poor 11.5% |
| Jamaicans | 10.9 /100 | #203 | Poor 11.5% |
| Immigrants | Cambodia | 10.8 /100 | #204 | Poor 11.5% |
| Serbians | 10.7 /100 | #205 | Poor 11.5% |
| Ukrainians | 10.6 /100 | #206 | Poor 11.5% |
| Immigrants | Somalia | 10.4 /100 | #207 | Poor 11.5% |
| Icelanders | 10.1 /100 | #208 | Poor 11.6% |
| Spanish American Indians | 10.1 /100 | #209 | Poor 11.6% |
| Ute | 9.4 /100 | #210 | Tragic 11.6% |
Demographics Similar to Immigrants from Belize by Male Disability
In terms of male disability, the demographic groups most similar to Immigrants from Belize are Immigrants from Senegal (11.3%, a difference of 0.040%), Immigrants from Central America (11.3%, a difference of 0.050%), Iraqi (11.3%, a difference of 0.20%), Pakistani (11.3%, a difference of 0.21%), and Immigrants from Zaire (11.4%, a difference of 0.39%).
| Demographics | Rating | Rank | Male Disability |
| Immigrants | Honduras | 48.7 /100 | #175 | Average 11.2% |
| Syrians | 46.6 /100 | #176 | Average 11.2% |
| Immigrants | Norway | 44.2 /100 | #177 | Average 11.3% |
| Australians | 42.2 /100 | #178 | Average 11.3% |
| Immigrants | Caribbean | 41.4 /100 | #179 | Average 11.3% |
| Hondurans | 41.1 /100 | #180 | Average 11.3% |
| Immigrants | Senegal | 34.4 /100 | #181 | Fair 11.3% |
| Immigrants | Belize | 33.7 /100 | #182 | Fair 11.3% |
| Immigrants | Central America | 32.9 /100 | #183 | Fair 11.3% |
| Iraqis | 30.5 /100 | #184 | Fair 11.3% |
| Pakistanis | 30.3 /100 | #185 | Fair 11.3% |
| Immigrants | Zaire | 27.6 /100 | #186 | Fair 11.4% |
| Immigrants | Austria | 27.3 /100 | #187 | Fair 11.4% |
| Estonians | 26.8 /100 | #188 | Fair 11.4% |
| Immigrants | Netherlands | 25.9 /100 | #189 | Fair 11.4% |