Jamaican vs Alsatian Male Disability
COMPARE
Jamaican
Alsatian
Male Disability
Male Disability Comparison
Jamaicans
Alsatians
11.5%
MALE DISABILITY
10.9/ 100
METRIC RATING
203rd/ 347
METRIC RANK
11.7%
MALE DISABILITY
3.3/ 100
METRIC RATING
222nd/ 347
METRIC RANK
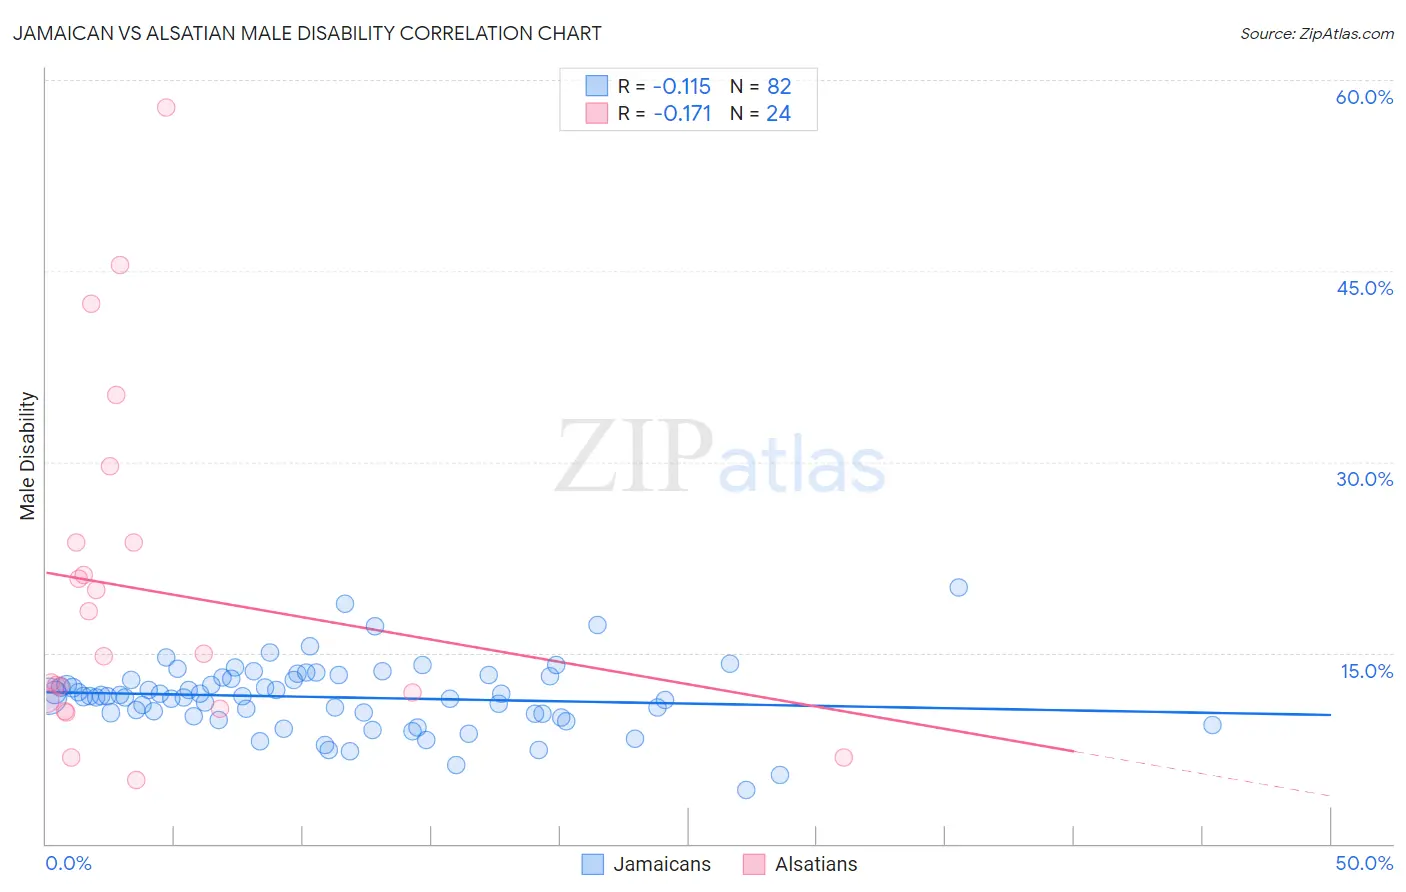
Jamaican vs Alsatian Male Disability Correlation Chart
The statistical analysis conducted on geographies consisting of 367,937,563 people shows a poor negative correlation between the proportion of Jamaicans and percentage of males with a disability in the United States with a correlation coefficient (R) of -0.115 and weighted average of 11.5%. Similarly, the statistical analysis conducted on geographies consisting of 82,682,247 people shows a poor negative correlation between the proportion of Alsatians and percentage of males with a disability in the United States with a correlation coefficient (R) of -0.171 and weighted average of 11.7%, a difference of 1.7%.
Male Disability Correlation Summary
| Measurement | Jamaican | Alsatian |
| Minimum | 4.2% | 5.0% |
| Maximum | 20.1% | 57.8% |
| Range | 15.9% | 52.8% |
| Mean | 11.5% | 19.9% |
| Median | 11.6% | 14.9% |
| Interquartile 25% (IQ1) | 10.2% | 10.9% |
| Interquartile 75% (IQ3) | 13.1% | 23.6% |
| Interquartile Range (IQR) | 2.9% | 12.7% |
| Standard Deviation (Sample) | 2.7% | 13.4% |
| Standard Deviation (Population) | 2.7% | 13.1% |
Demographics Similar to Jamaicans and Alsatians by Male Disability
In terms of male disability, the demographic groups most similar to Jamaicans are Immigrants from Cambodia (11.5%, a difference of 0.010%), Serbian (11.5%, a difference of 0.020%), Ukrainian (11.5%, a difference of 0.030%), Immigrants from Somalia (11.5%, a difference of 0.060%), and Icelander (11.6%, a difference of 0.10%). Similarly, the demographic groups most similar to Alsatians are Immigrants from Congo (11.7%, a difference of 0.15%), Panamanian (11.7%, a difference of 0.17%), Immigrants from Western Europe (11.7%, a difference of 0.17%), Immigrants from England (11.7%, a difference of 0.23%), and Immigrants from Dominica (11.7%, a difference of 0.45%).
| Demographics | Rating | Rank | Male Disability |
| Immigrants | Mexico | 12.6 /100 | #202 | Poor 11.5% |
| Jamaicans | 10.9 /100 | #203 | Poor 11.5% |
| Immigrants | Cambodia | 10.8 /100 | #204 | Poor 11.5% |
| Serbians | 10.7 /100 | #205 | Poor 11.5% |
| Ukrainians | 10.6 /100 | #206 | Poor 11.5% |
| Immigrants | Somalia | 10.4 /100 | #207 | Poor 11.5% |
| Icelanders | 10.1 /100 | #208 | Poor 11.6% |
| Spanish American Indians | 10.1 /100 | #209 | Poor 11.6% |
| Ute | 9.4 /100 | #210 | Tragic 11.6% |
| Immigrants | Thailand | 8.4 /100 | #211 | Tragic 11.6% |
| Immigrants | Scotland | 8.2 /100 | #212 | Tragic 11.6% |
| Mexican American Indians | 7.8 /100 | #213 | Tragic 11.6% |
| Lithuanians | 6.6 /100 | #214 | Tragic 11.6% |
| Indonesians | 5.9 /100 | #215 | Tragic 11.6% |
| Immigrants | Dominican Republic | 4.9 /100 | #216 | Tragic 11.7% |
| Immigrants | Dominica | 4.6 /100 | #217 | Tragic 11.7% |
| Immigrants | England | 4.0 /100 | #218 | Tragic 11.7% |
| Panamanians | 3.8 /100 | #219 | Tragic 11.7% |
| Immigrants | Western Europe | 3.8 /100 | #220 | Tragic 11.7% |
| Immigrants | Congo | 3.7 /100 | #221 | Tragic 11.7% |
| Alsatians | 3.3 /100 | #222 | Tragic 11.7% |