Serbian vs Houma Disability Age Under 5
COMPARE
Serbian
Houma
Disability Age Under 5
Disability Age Under 5 Comparison
Serbians
Houma
1.3%
DISABILITY AGE UNDER 5
9.6/ 100
METRIC RATING
220th/ 347
METRIC RANK
1.9%
DISABILITY AGE UNDER 5
0.0/ 100
METRIC RATING
329th/ 347
METRIC RANK
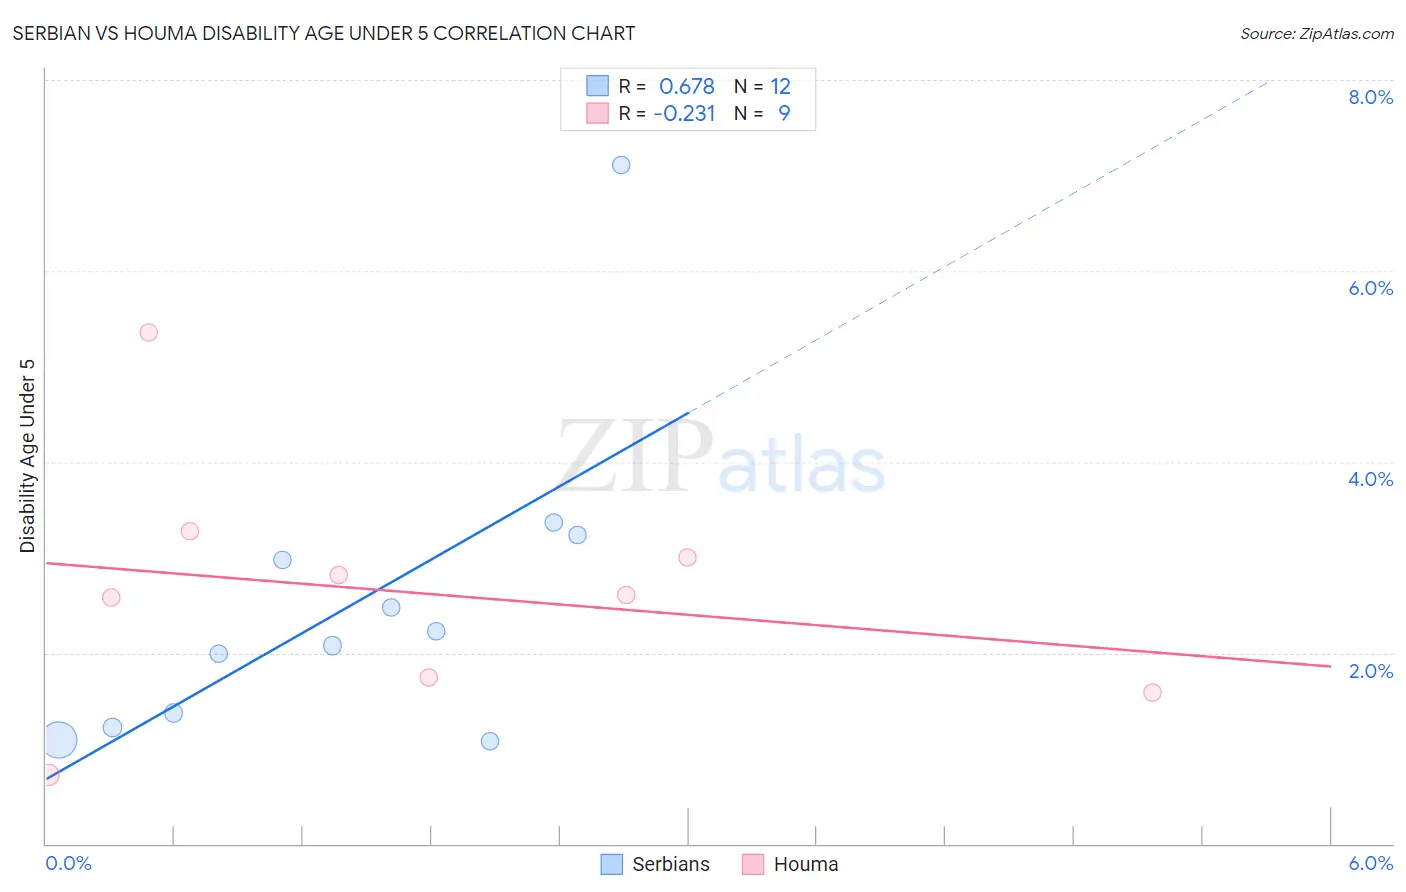
Serbian vs Houma Disability Age Under 5 Correlation Chart
The statistical analysis conducted on geographies consisting of 160,287,389 people shows a significant positive correlation between the proportion of Serbians and percentage of population with a disability under the age of 5 in the United States with a correlation coefficient (R) of 0.678 and weighted average of 1.3%. Similarly, the statistical analysis conducted on geographies consisting of 31,359,385 people shows a weak negative correlation between the proportion of Houma and percentage of population with a disability under the age of 5 in the United States with a correlation coefficient (R) of -0.231 and weighted average of 1.9%, a difference of 43.3%.
Disability Age Under 5 Correlation Summary
| Measurement | Serbian | Houma |
| Minimum | 1.1% | 0.72% |
| Maximum | 7.1% | 5.4% |
| Range | 6.0% | 4.6% |
| Mean | 2.5% | 2.6% |
| Median | 2.1% | 2.6% |
| Interquartile 25% (IQ1) | 1.3% | 1.7% |
| Interquartile 75% (IQ3) | 3.1% | 3.1% |
| Interquartile Range (IQR) | 1.8% | 1.5% |
| Standard Deviation (Sample) | 1.7% | 1.3% |
| Standard Deviation (Population) | 1.6% | 1.2% |
Similar Demographics by Disability Age Under 5
Demographics Similar to Serbians by Disability Age Under 5
In terms of disability age under 5, the demographic groups most similar to Serbians are Subsaharan African (1.3%, a difference of 0.34%), Ukrainian (1.3%, a difference of 0.34%), Immigrants from Croatia (1.3%, a difference of 0.37%), Hispanic or Latino (1.3%, a difference of 0.53%), and Latvian (1.3%, a difference of 0.69%).
| Demographics | Rating | Rank | Disability Age Under 5 |
| Immigrants | Sudan | 18.7 /100 | #213 | Poor 1.3% |
| Immigrants | Chile | 17.2 /100 | #214 | Poor 1.3% |
| Syrians | 16.1 /100 | #215 | Poor 1.3% |
| Bangladeshis | 15.5 /100 | #216 | Poor 1.3% |
| Cypriots | 14.9 /100 | #217 | Poor 1.3% |
| Malaysians | 13.2 /100 | #218 | Poor 1.3% |
| Immigrants | Croatia | 11.2 /100 | #219 | Poor 1.3% |
| Serbians | 9.6 /100 | #220 | Tragic 1.3% |
| Sub-Saharan Africans | 8.3 /100 | #221 | Tragic 1.3% |
| Ukrainians | 8.3 /100 | #222 | Tragic 1.3% |
| Hispanics or Latinos | 7.7 /100 | #223 | Tragic 1.3% |
| Latvians | 7.1 /100 | #224 | Tragic 1.3% |
| Panamanians | 7.1 /100 | #225 | Tragic 1.3% |
| Bahamians | 7.1 /100 | #226 | Tragic 1.3% |
| Taiwanese | 6.1 /100 | #227 | Tragic 1.3% |
Demographics Similar to Houma by Disability Age Under 5
In terms of disability age under 5, the demographic groups most similar to Houma are Choctaw (1.9%, a difference of 0.32%), American (1.9%, a difference of 0.47%), French Canadian (1.9%, a difference of 0.62%), Chippewa (1.9%, a difference of 0.69%), and Osage (1.8%, a difference of 2.2%).
| Demographics | Rating | Rank | Disability Age Under 5 |
| Germans | 0.0 /100 | #322 | Tragic 1.7% |
| Chickasaw | 0.0 /100 | #323 | Tragic 1.7% |
| Cherokee | 0.0 /100 | #324 | Tragic 1.8% |
| Immigrants | Portugal | 0.0 /100 | #325 | Tragic 1.8% |
| Sioux | 0.0 /100 | #326 | Tragic 1.8% |
| Osage | 0.0 /100 | #327 | Tragic 1.8% |
| Americans | 0.0 /100 | #328 | Tragic 1.9% |
| Houma | 0.0 /100 | #329 | Tragic 1.9% |
| Choctaw | 0.0 /100 | #330 | Tragic 1.9% |
| French Canadians | 0.0 /100 | #331 | Tragic 1.9% |
| Chippewa | 0.0 /100 | #332 | Tragic 1.9% |
| Dutch West Indians | 0.0 /100 | #333 | Tragic 1.9% |
| Natives/Alaskans | 0.0 /100 | #334 | Tragic 1.9% |
| Pennsylvania Germans | 0.0 /100 | #335 | Tragic 1.9% |
| Paraguayans | 0.0 /100 | #336 | Tragic 2.0% |