Maltese vs Houma Disability Age Under 5
COMPARE
Maltese
Houma
Disability Age Under 5
Disability Age Under 5 Comparison
Maltese
Houma
1.3%
DISABILITY AGE UNDER 5
2.2/ 100
METRIC RATING
241st/ 347
METRIC RANK
1.9%
DISABILITY AGE UNDER 5
0.0/ 100
METRIC RATING
329th/ 347
METRIC RANK
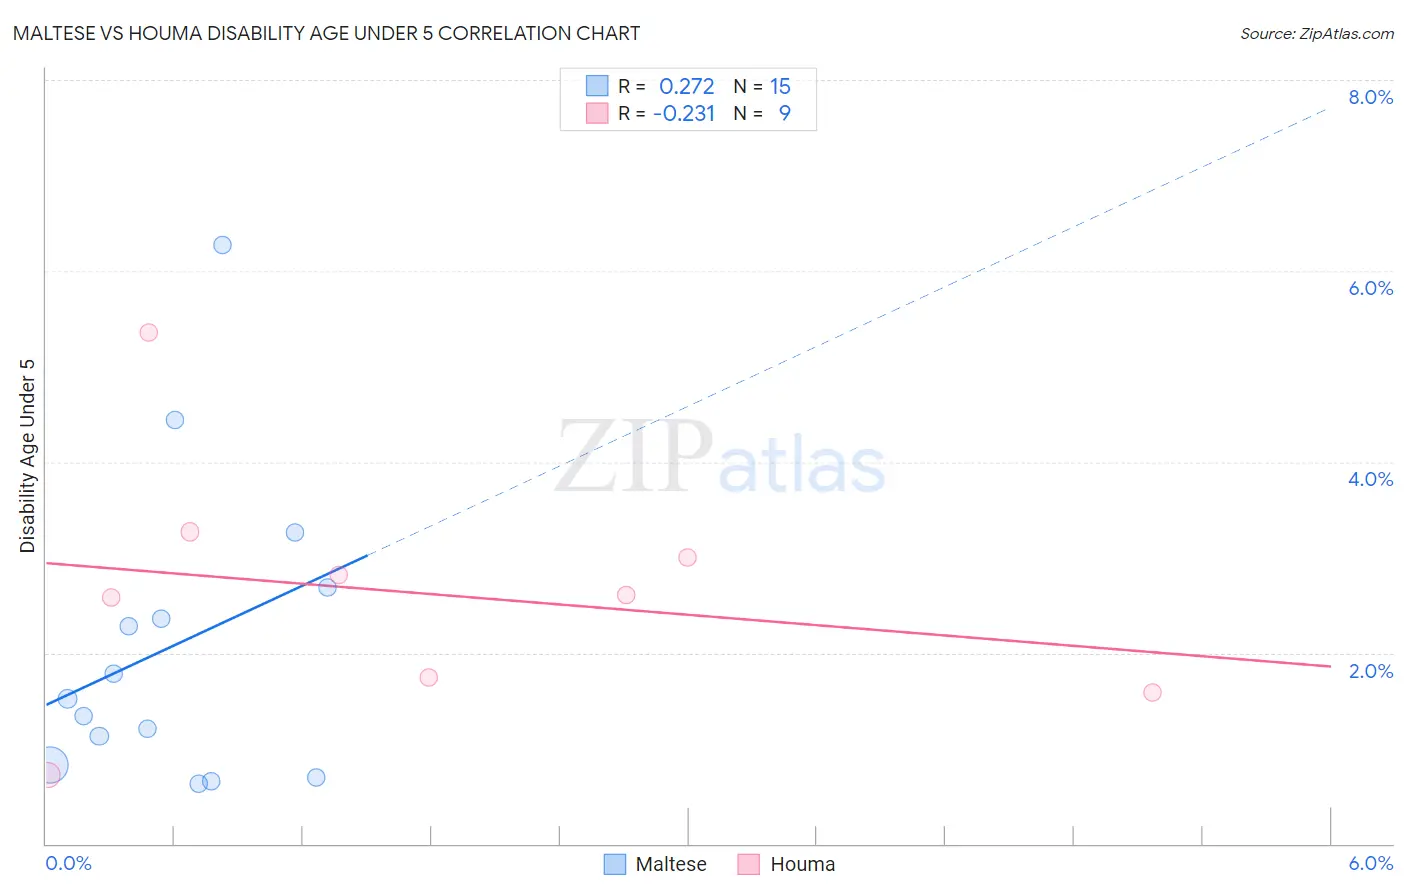
Maltese vs Houma Disability Age Under 5 Correlation Chart
The statistical analysis conducted on geographies consisting of 87,586,086 people shows a weak positive correlation between the proportion of Maltese and percentage of population with a disability under the age of 5 in the United States with a correlation coefficient (R) of 0.272 and weighted average of 1.3%. Similarly, the statistical analysis conducted on geographies consisting of 31,359,385 people shows a weak negative correlation between the proportion of Houma and percentage of population with a disability under the age of 5 in the United States with a correlation coefficient (R) of -0.231 and weighted average of 1.9%, a difference of 38.6%.
Disability Age Under 5 Correlation Summary
| Measurement | Maltese | Houma |
| Minimum | 0.63% | 0.72% |
| Maximum | 6.3% | 5.4% |
| Range | 5.6% | 4.6% |
| Mean | 2.1% | 2.6% |
| Median | 1.5% | 2.6% |
| Interquartile 25% (IQ1) | 0.83% | 1.7% |
| Interquartile 75% (IQ3) | 2.7% | 3.1% |
| Interquartile Range (IQR) | 1.9% | 1.5% |
| Standard Deviation (Sample) | 1.6% | 1.3% |
| Standard Deviation (Population) | 1.5% | 1.2% |
Similar Demographics by Disability Age Under 5
Demographics Similar to Maltese by Disability Age Under 5
In terms of disability age under 5, the demographic groups most similar to Maltese are Native Hawaiian (1.3%, a difference of 0.070%), Lumbee (1.3%, a difference of 0.080%), Immigrants from Austria (1.3%, a difference of 0.090%), Spanish American Indian (1.3%, a difference of 0.25%), and Immigrants from Cameroon (1.4%, a difference of 0.46%).
| Demographics | Rating | Rank | Disability Age Under 5 |
| Pueblo | 3.8 /100 | #234 | Tragic 1.3% |
| Central American Indians | 3.6 /100 | #235 | Tragic 1.3% |
| South American Indians | 3.3 /100 | #236 | Tragic 1.3% |
| Basques | 3.0 /100 | #237 | Tragic 1.3% |
| Spanish American Indians | 2.4 /100 | #238 | Tragic 1.3% |
| Immigrants | Austria | 2.3 /100 | #239 | Tragic 1.3% |
| Native Hawaiians | 2.2 /100 | #240 | Tragic 1.3% |
| Maltese | 2.2 /100 | #241 | Tragic 1.3% |
| Lumbee | 2.1 /100 | #242 | Tragic 1.3% |
| Immigrants | Cameroon | 1.7 /100 | #243 | Tragic 1.4% |
| Spaniards | 1.4 /100 | #244 | Tragic 1.4% |
| Potawatomi | 1.1 /100 | #245 | Tragic 1.4% |
| Russians | 1.0 /100 | #246 | Tragic 1.4% |
| Immigrants | England | 1.0 /100 | #247 | Tragic 1.4% |
| Eastern Europeans | 1.0 /100 | #248 | Tragic 1.4% |
Demographics Similar to Houma by Disability Age Under 5
In terms of disability age under 5, the demographic groups most similar to Houma are Choctaw (1.9%, a difference of 0.32%), American (1.9%, a difference of 0.47%), French Canadian (1.9%, a difference of 0.62%), Chippewa (1.9%, a difference of 0.69%), and Osage (1.8%, a difference of 2.2%).
| Demographics | Rating | Rank | Disability Age Under 5 |
| Germans | 0.0 /100 | #322 | Tragic 1.7% |
| Chickasaw | 0.0 /100 | #323 | Tragic 1.7% |
| Cherokee | 0.0 /100 | #324 | Tragic 1.8% |
| Immigrants | Portugal | 0.0 /100 | #325 | Tragic 1.8% |
| Sioux | 0.0 /100 | #326 | Tragic 1.8% |
| Osage | 0.0 /100 | #327 | Tragic 1.8% |
| Americans | 0.0 /100 | #328 | Tragic 1.9% |
| Houma | 0.0 /100 | #329 | Tragic 1.9% |
| Choctaw | 0.0 /100 | #330 | Tragic 1.9% |
| French Canadians | 0.0 /100 | #331 | Tragic 1.9% |
| Chippewa | 0.0 /100 | #332 | Tragic 1.9% |
| Dutch West Indians | 0.0 /100 | #333 | Tragic 1.9% |
| Natives/Alaskans | 0.0 /100 | #334 | Tragic 1.9% |
| Pennsylvania Germans | 0.0 /100 | #335 | Tragic 1.9% |
| Paraguayans | 0.0 /100 | #336 | Tragic 2.0% |