Israeli vs Immigrants from Eastern Europe Median Family Income
COMPARE
Israeli
Immigrants from Eastern Europe
Median Family Income
Median Family Income Comparison
Israelis
Immigrants from Eastern Europe
$118,577
MEDIAN FAMILY INCOME
100.0/ 100
METRIC RATING
36th/ 347
METRIC RANK
$112,527
MEDIAN FAMILY INCOME
99.4/ 100
METRIC RATING
77th/ 347
METRIC RANK
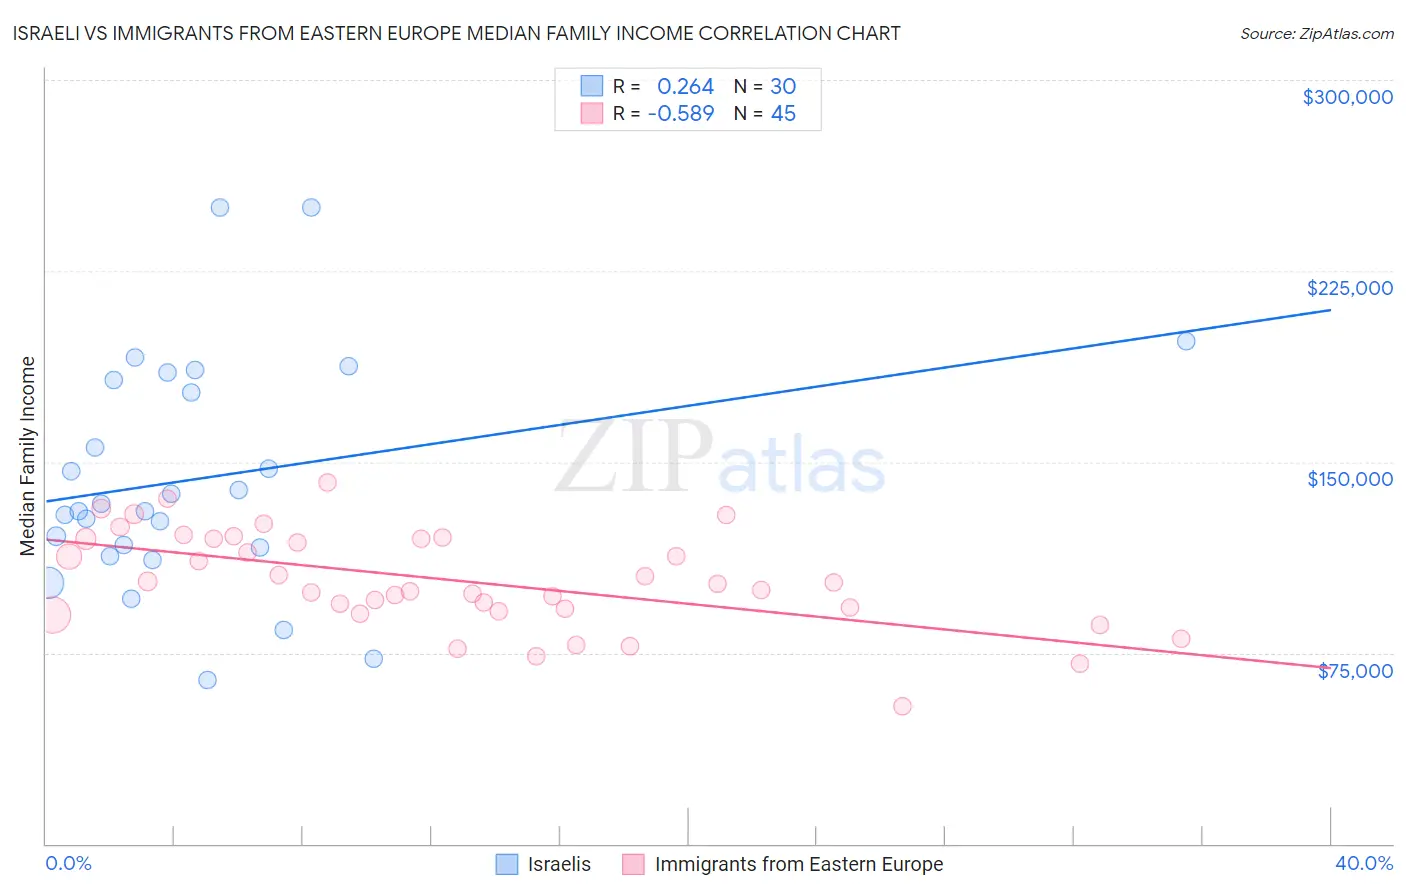
Israeli vs Immigrants from Eastern Europe Median Family Income Correlation Chart
The statistical analysis conducted on geographies consisting of 210,932,899 people shows a weak positive correlation between the proportion of Israelis and median family income in the United States with a correlation coefficient (R) of 0.264 and weighted average of $118,577. Similarly, the statistical analysis conducted on geographies consisting of 475,294,506 people shows a substantial negative correlation between the proportion of Immigrants from Eastern Europe and median family income in the United States with a correlation coefficient (R) of -0.589 and weighted average of $112,527, a difference of 5.4%.
Median Family Income Correlation Summary
| Measurement | Israeli | Immigrants from Eastern Europe |
| Minimum | $64,441 | $53,863 |
| Maximum | $250,001 | $142,041 |
| Range | $185,560 | $88,178 |
| Mean | $143,645 | $103,481 |
| Median | $132,084 | $102,281 |
| Interquartile 25% (IQ1) | $116,332 | $91,657 |
| Interquartile 75% (IQ3) | $182,189 | $119,896 |
| Interquartile Range (IQR) | $65,857 | $28,238 |
| Standard Deviation (Sample) | $45,469 | $19,233 |
| Standard Deviation (Population) | $44,705 | $19,018 |
Similar Demographics by Median Family Income
Demographics Similar to Israelis by Median Family Income
In terms of median family income, the demographic groups most similar to Israelis are Australian ($118,440, a difference of 0.12%), Immigrants from Turkey ($118,325, a difference of 0.21%), Immigrants from Asia ($118,291, a difference of 0.24%), Immigrants from Lithuania ($118,053, a difference of 0.44%), and Estonian ($118,013, a difference of 0.48%).
| Demographics | Rating | Rank | Median Family Income |
| Latvians | 100.0 /100 | #29 | Exceptional $120,301 |
| Immigrants | Sri Lanka | 100.0 /100 | #30 | Exceptional $120,263 |
| Immigrants | France | 100.0 /100 | #31 | Exceptional $120,076 |
| Asians | 100.0 /100 | #32 | Exceptional $119,955 |
| Bhutanese | 100.0 /100 | #33 | Exceptional $119,800 |
| Bolivians | 100.0 /100 | #34 | Exceptional $119,479 |
| Soviet Union | 100.0 /100 | #35 | Exceptional $119,262 |
| Israelis | 100.0 /100 | #36 | Exceptional $118,577 |
| Australians | 100.0 /100 | #37 | Exceptional $118,440 |
| Immigrants | Turkey | 100.0 /100 | #38 | Exceptional $118,325 |
| Immigrants | Asia | 100.0 /100 | #39 | Exceptional $118,291 |
| Immigrants | Lithuania | 100.0 /100 | #40 | Exceptional $118,053 |
| Estonians | 100.0 /100 | #41 | Exceptional $118,013 |
| Immigrants | Bolivia | 100.0 /100 | #42 | Exceptional $117,912 |
| Bulgarians | 100.0 /100 | #43 | Exceptional $117,818 |
Demographics Similar to Immigrants from Eastern Europe by Median Family Income
In terms of median family income, the demographic groups most similar to Immigrants from Eastern Europe are Argentinean ($112,665, a difference of 0.12%), Immigrants from Western Europe ($112,688, a difference of 0.14%), Immigrants from Canada ($112,374, a difference of 0.14%), Italian ($112,372, a difference of 0.14%), and Immigrants from Croatia ($112,323, a difference of 0.18%).
| Demographics | Rating | Rank | Median Family Income |
| Immigrants | Romania | 99.6 /100 | #70 | Exceptional $113,434 |
| South Africans | 99.5 /100 | #71 | Exceptional $113,229 |
| Afghans | 99.5 /100 | #72 | Exceptional $112,971 |
| Laotians | 99.5 /100 | #73 | Exceptional $112,859 |
| Immigrants | Italy | 99.4 /100 | #74 | Exceptional $112,848 |
| Immigrants | Western Europe | 99.4 /100 | #75 | Exceptional $112,688 |
| Argentineans | 99.4 /100 | #76 | Exceptional $112,665 |
| Immigrants | Eastern Europe | 99.4 /100 | #77 | Exceptional $112,527 |
| Immigrants | Canada | 99.3 /100 | #78 | Exceptional $112,374 |
| Italians | 99.3 /100 | #79 | Exceptional $112,372 |
| Immigrants | Croatia | 99.3 /100 | #80 | Exceptional $112,323 |
| Immigrants | North America | 99.2 /100 | #81 | Exceptional $112,151 |
| Immigrants | England | 99.2 /100 | #82 | Exceptional $112,038 |
| Immigrants | Egypt | 99.0 /100 | #83 | Exceptional $111,689 |
| Immigrants | Hungary | 98.8 /100 | #84 | Exceptional $111,378 |