Inupiat vs Nigerian Disability
COMPARE
Inupiat
Nigerian
Disability
Disability Comparison
Inupiat
Nigerians
12.2%
DISABILITY
2.8/ 100
METRIC RATING
229th/ 347
METRIC RANK
11.5%
DISABILITY
81.3/ 100
METRIC RATING
145th/ 347
METRIC RANK
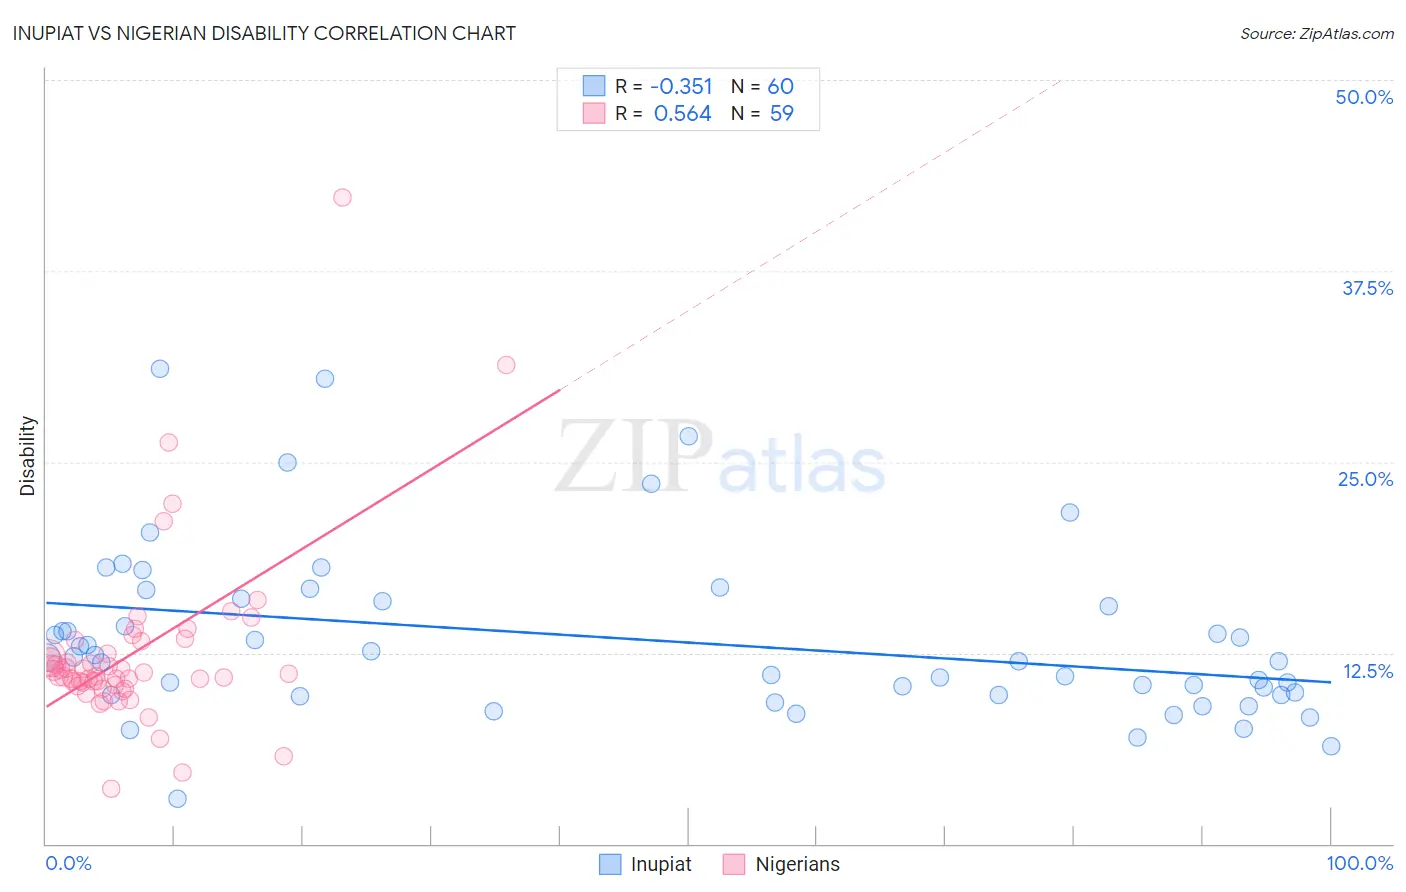
Inupiat vs Nigerian Disability Correlation Chart
The statistical analysis conducted on geographies consisting of 96,338,624 people shows a mild negative correlation between the proportion of Inupiat and percentage of population with a disability in the United States with a correlation coefficient (R) of -0.351 and weighted average of 12.2%. Similarly, the statistical analysis conducted on geographies consisting of 332,745,371 people shows a substantial positive correlation between the proportion of Nigerians and percentage of population with a disability in the United States with a correlation coefficient (R) of 0.564 and weighted average of 11.5%, a difference of 5.6%.
Disability Correlation Summary
| Measurement | Inupiat | Nigerian |
| Minimum | 2.9% | 3.6% |
| Maximum | 31.1% | 42.3% |
| Range | 28.2% | 38.7% |
| Mean | 13.4% | 12.5% |
| Median | 12.1% | 11.1% |
| Interquartile 25% (IQ1) | 9.8% | 10.4% |
| Interquartile 75% (IQ3) | 16.0% | 13.3% |
| Interquartile Range (IQR) | 6.2% | 2.9% |
| Standard Deviation (Sample) | 5.6% | 5.9% |
| Standard Deviation (Population) | 5.6% | 5.8% |
Similar Demographics by Disability
Demographics Similar to Inupiat by Disability
In terms of disability, the demographic groups most similar to Inupiat are West Indian (12.2%, a difference of 0.020%), Samoan (12.2%, a difference of 0.080%), Malaysian (12.2%, a difference of 0.11%), Italian (12.2%, a difference of 0.12%), and Alsatian (12.1%, a difference of 0.16%).
| Demographics | Rating | Rank | Disability |
| Spanish American Indians | 4.1 /100 | #222 | Tragic 12.1% |
| Hispanics or Latinos | 3.9 /100 | #223 | Tragic 12.1% |
| Mexicans | 3.7 /100 | #224 | Tragic 12.1% |
| Senegalese | 3.5 /100 | #225 | Tragic 12.1% |
| Jamaicans | 3.3 /100 | #226 | Tragic 12.1% |
| Alsatians | 3.3 /100 | #227 | Tragic 12.1% |
| West Indians | 2.9 /100 | #228 | Tragic 12.2% |
| Inupiat | 2.8 /100 | #229 | Tragic 12.2% |
| Samoans | 2.6 /100 | #230 | Tragic 12.2% |
| Malaysians | 2.5 /100 | #231 | Tragic 12.2% |
| Italians | 2.5 /100 | #232 | Tragic 12.2% |
| Bahamians | 2.3 /100 | #233 | Tragic 12.2% |
| Japanese | 2.3 /100 | #234 | Tragic 12.2% |
| Yup'ik | 2.2 /100 | #235 | Tragic 12.2% |
| Chinese | 2.0 /100 | #236 | Tragic 12.2% |
Demographics Similar to Nigerians by Disability
In terms of disability, the demographic groups most similar to Nigerians are Australian (11.5%, a difference of 0.090%), Moroccan (11.5%, a difference of 0.15%), Immigrants from Hungary (11.5%, a difference of 0.16%), Immigrants from Ukraine (11.5%, a difference of 0.26%), and Sudanese (11.5%, a difference of 0.29%).
| Demographics | Rating | Rank | Disability |
| New Zealanders | 87.0 /100 | #138 | Excellent 11.5% |
| Ghanaians | 87.0 /100 | #139 | Excellent 11.5% |
| Russians | 86.8 /100 | #140 | Excellent 11.5% |
| Immigrants | Grenada | 86.1 /100 | #141 | Excellent 11.5% |
| Immigrants | Sudan | 85.3 /100 | #142 | Excellent 11.5% |
| Moroccans | 83.3 /100 | #143 | Excellent 11.5% |
| Australians | 82.5 /100 | #144 | Excellent 11.5% |
| Nigerians | 81.3 /100 | #145 | Excellent 11.5% |
| Immigrants | Hungary | 79.0 /100 | #146 | Good 11.5% |
| Immigrants | Ukraine | 77.6 /100 | #147 | Good 11.5% |
| Sudanese | 77.1 /100 | #148 | Good 11.5% |
| Immigrants | Norway | 73.2 /100 | #149 | Good 11.6% |
| Romanians | 72.7 /100 | #150 | Good 11.6% |
| Immigrants | Kenya | 72.1 /100 | #151 | Good 11.6% |
| Immigrants | Moldova | 72.0 /100 | #152 | Good 11.6% |