Inupiat vs Scottish Disability
COMPARE
Inupiat
Scottish
Disability
Disability Comparison
Inupiat
Scottish
12.2%
DISABILITY
2.8/ 100
METRIC RATING
229th/ 347
METRIC RANK
12.9%
DISABILITY
0.0/ 100
METRIC RATING
282nd/ 347
METRIC RANK
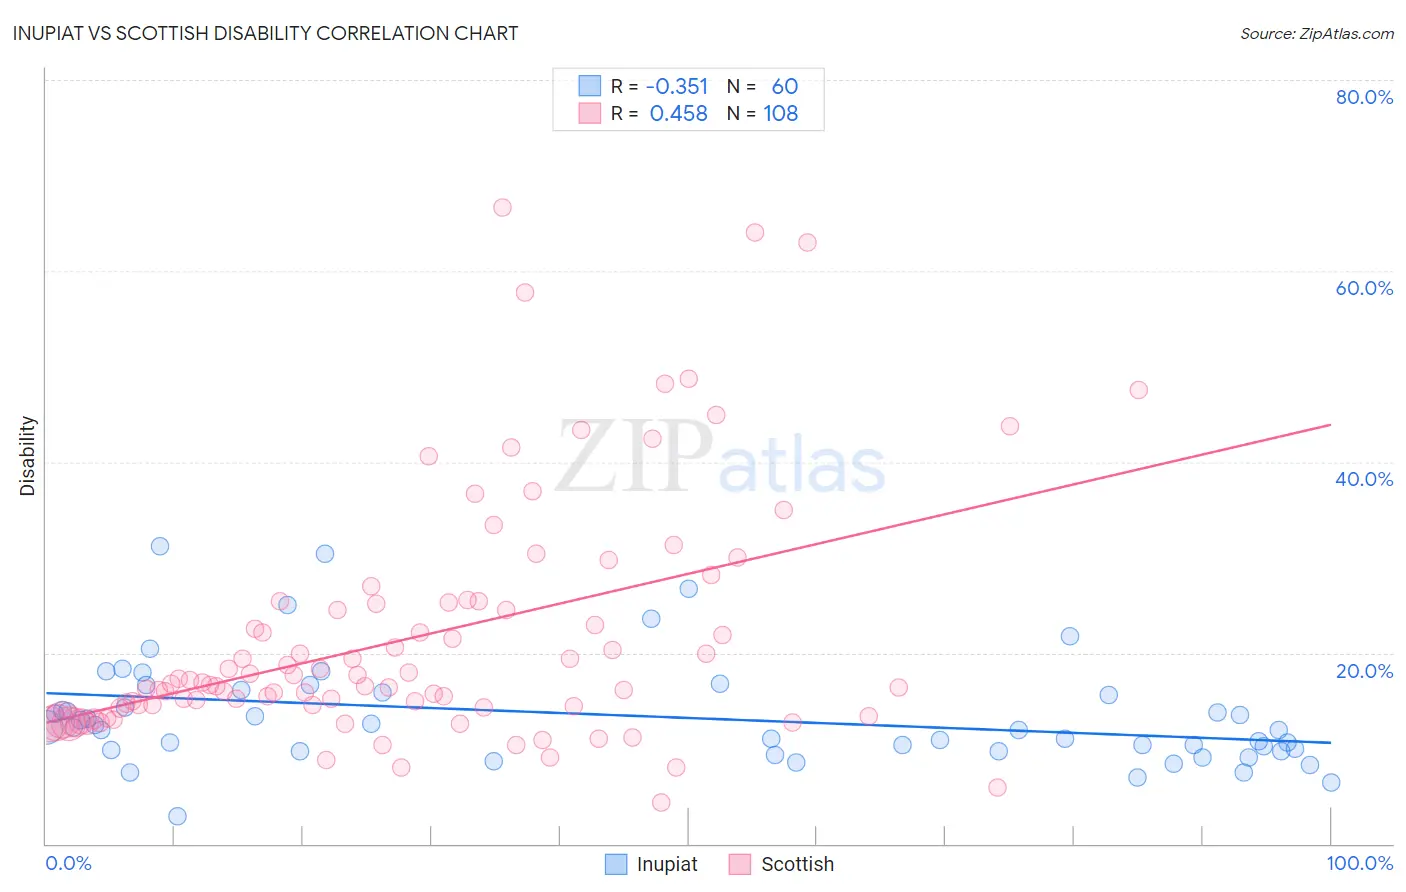
Inupiat vs Scottish Disability Correlation Chart
The statistical analysis conducted on geographies consisting of 96,338,624 people shows a mild negative correlation between the proportion of Inupiat and percentage of population with a disability in the United States with a correlation coefficient (R) of -0.351 and weighted average of 12.2%. Similarly, the statistical analysis conducted on geographies consisting of 567,015,833 people shows a moderate positive correlation between the proportion of Scottish and percentage of population with a disability in the United States with a correlation coefficient (R) of 0.458 and weighted average of 12.9%, a difference of 5.9%.
Disability Correlation Summary
| Measurement | Inupiat | Scottish |
| Minimum | 2.9% | 4.3% |
| Maximum | 31.1% | 66.7% |
| Range | 28.2% | 62.3% |
| Mean | 13.4% | 21.6% |
| Median | 12.1% | 16.7% |
| Interquartile 25% (IQ1) | 9.8% | 14.2% |
| Interquartile 75% (IQ3) | 16.0% | 25.2% |
| Interquartile Range (IQR) | 6.2% | 11.0% |
| Standard Deviation (Sample) | 5.6% | 12.7% |
| Standard Deviation (Population) | 5.6% | 12.6% |
Similar Demographics by Disability
Demographics Similar to Inupiat by Disability
In terms of disability, the demographic groups most similar to Inupiat are West Indian (12.2%, a difference of 0.020%), Samoan (12.2%, a difference of 0.080%), Malaysian (12.2%, a difference of 0.11%), Italian (12.2%, a difference of 0.12%), and Alsatian (12.1%, a difference of 0.16%).
| Demographics | Rating | Rank | Disability |
| Spanish American Indians | 4.1 /100 | #222 | Tragic 12.1% |
| Hispanics or Latinos | 3.9 /100 | #223 | Tragic 12.1% |
| Mexicans | 3.7 /100 | #224 | Tragic 12.1% |
| Senegalese | 3.5 /100 | #225 | Tragic 12.1% |
| Jamaicans | 3.3 /100 | #226 | Tragic 12.1% |
| Alsatians | 3.3 /100 | #227 | Tragic 12.1% |
| West Indians | 2.9 /100 | #228 | Tragic 12.2% |
| Inupiat | 2.8 /100 | #229 | Tragic 12.2% |
| Samoans | 2.6 /100 | #230 | Tragic 12.2% |
| Malaysians | 2.5 /100 | #231 | Tragic 12.2% |
| Italians | 2.5 /100 | #232 | Tragic 12.2% |
| Bahamians | 2.3 /100 | #233 | Tragic 12.2% |
| Japanese | 2.3 /100 | #234 | Tragic 12.2% |
| Yup'ik | 2.2 /100 | #235 | Tragic 12.2% |
| Chinese | 2.0 /100 | #236 | Tragic 12.2% |
Demographics Similar to Scottish by Disability
In terms of disability, the demographic groups most similar to Scottish are Irish (12.9%, a difference of 0.020%), Immigrants from Portugal (12.9%, a difference of 0.14%), Welsh (12.9%, a difference of 0.22%), Crow (12.9%, a difference of 0.22%), and Spanish (12.8%, a difference of 0.28%).
| Demographics | Rating | Rank | Disability |
| Sioux | 0.0 /100 | #275 | Tragic 12.8% |
| Hmong | 0.0 /100 | #276 | Tragic 12.8% |
| Dutch | 0.0 /100 | #277 | Tragic 12.8% |
| Germans | 0.0 /100 | #278 | Tragic 12.8% |
| Fijians | 0.0 /100 | #279 | Tragic 12.8% |
| Spanish | 0.0 /100 | #280 | Tragic 12.8% |
| Immigrants | Portugal | 0.0 /100 | #281 | Tragic 12.9% |
| Scottish | 0.0 /100 | #282 | Tragic 12.9% |
| Irish | 0.0 /100 | #283 | Tragic 12.9% |
| Welsh | 0.0 /100 | #284 | Tragic 12.9% |
| Crow | 0.0 /100 | #285 | Tragic 12.9% |
| English | 0.0 /100 | #286 | Tragic 13.0% |
| Africans | 0.0 /100 | #287 | Tragic 13.0% |
| Whites/Caucasians | 0.0 /100 | #288 | Tragic 13.0% |
| Slovaks | 0.0 /100 | #289 | Tragic 13.0% |