Immigrants from Denmark vs Nigerian Disability
COMPARE
Immigrants from Denmark
Nigerian
Disability
Disability Comparison
Immigrants from Denmark
Nigerians
11.3%
DISABILITY
95.6/ 100
METRIC RATING
110th/ 347
METRIC RANK
11.5%
DISABILITY
81.3/ 100
METRIC RATING
145th/ 347
METRIC RANK
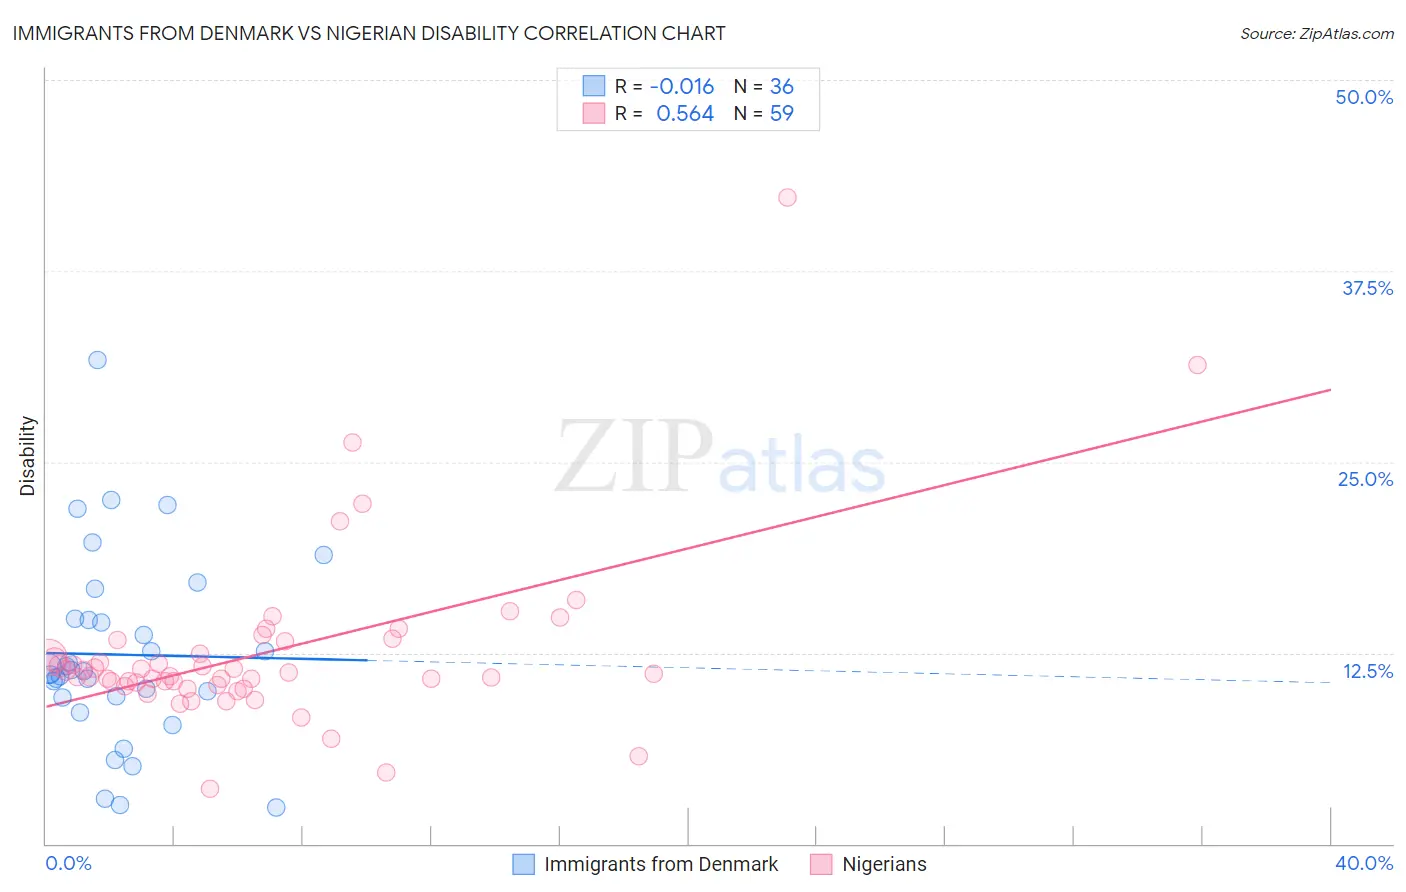
Immigrants from Denmark vs Nigerian Disability Correlation Chart
The statistical analysis conducted on geographies consisting of 136,432,465 people shows no correlation between the proportion of Immigrants from Denmark and percentage of population with a disability in the United States with a correlation coefficient (R) of -0.016 and weighted average of 11.3%. Similarly, the statistical analysis conducted on geographies consisting of 332,745,371 people shows a substantial positive correlation between the proportion of Nigerians and percentage of population with a disability in the United States with a correlation coefficient (R) of 0.564 and weighted average of 11.5%, a difference of 1.8%.
Disability Correlation Summary
| Measurement | Immigrants from Denmark | Nigerian |
| Minimum | 2.4% | 3.6% |
| Maximum | 31.7% | 42.3% |
| Range | 29.3% | 38.7% |
| Mean | 12.4% | 12.5% |
| Median | 11.3% | 11.1% |
| Interquartile 25% (IQ1) | 9.6% | 10.4% |
| Interquartile 75% (IQ3) | 14.7% | 13.3% |
| Interquartile Range (IQR) | 5.0% | 2.9% |
| Standard Deviation (Sample) | 6.1% | 5.9% |
| Standard Deviation (Population) | 6.0% | 5.8% |
Similar Demographics by Disability
Demographics Similar to Immigrants from Denmark by Disability
In terms of disability, the demographic groups most similar to Immigrants from Denmark are Immigrants from Uganda (11.3%, a difference of 0.020%), Immigrants from South Eastern Asia (11.3%, a difference of 0.070%), Immigrants from Nigeria (11.3%, a difference of 0.10%), Nicaraguan (11.3%, a difference of 0.18%), and Immigrants from Uzbekistan (11.3%, a difference of 0.18%).
| Demographics | Rating | Rank | Disability |
| Immigrants | Uruguay | 96.4 /100 | #103 | Exceptional 11.3% |
| Immigrants | Immigrants | 96.4 /100 | #104 | Exceptional 11.3% |
| Immigrants | Kazakhstan | 96.4 /100 | #105 | Exceptional 11.3% |
| Immigrants | Eastern Europe | 96.3 /100 | #106 | Exceptional 11.3% |
| Nicaraguans | 96.2 /100 | #107 | Exceptional 11.3% |
| Immigrants | Nigeria | 96.0 /100 | #108 | Exceptional 11.3% |
| Immigrants | Uganda | 95.7 /100 | #109 | Exceptional 11.3% |
| Immigrants | Denmark | 95.6 /100 | #110 | Exceptional 11.3% |
| Immigrants | South Eastern Asia | 95.4 /100 | #111 | Exceptional 11.3% |
| Immigrants | Uzbekistan | 94.9 /100 | #112 | Exceptional 11.3% |
| Guyanese | 94.7 /100 | #113 | Exceptional 11.3% |
| Immigrants | Syria | 94.7 /100 | #114 | Exceptional 11.3% |
| Immigrants | Philippines | 94.6 /100 | #115 | Exceptional 11.3% |
| Immigrants | Northern Europe | 94.1 /100 | #116 | Exceptional 11.3% |
| Luxembourgers | 93.9 /100 | #117 | Exceptional 11.3% |
Demographics Similar to Nigerians by Disability
In terms of disability, the demographic groups most similar to Nigerians are Australian (11.5%, a difference of 0.090%), Moroccan (11.5%, a difference of 0.15%), Immigrants from Hungary (11.5%, a difference of 0.16%), Immigrants from Ukraine (11.5%, a difference of 0.26%), and Sudanese (11.5%, a difference of 0.29%).
| Demographics | Rating | Rank | Disability |
| New Zealanders | 87.0 /100 | #138 | Excellent 11.5% |
| Ghanaians | 87.0 /100 | #139 | Excellent 11.5% |
| Russians | 86.8 /100 | #140 | Excellent 11.5% |
| Immigrants | Grenada | 86.1 /100 | #141 | Excellent 11.5% |
| Immigrants | Sudan | 85.3 /100 | #142 | Excellent 11.5% |
| Moroccans | 83.3 /100 | #143 | Excellent 11.5% |
| Australians | 82.5 /100 | #144 | Excellent 11.5% |
| Nigerians | 81.3 /100 | #145 | Excellent 11.5% |
| Immigrants | Hungary | 79.0 /100 | #146 | Good 11.5% |
| Immigrants | Ukraine | 77.6 /100 | #147 | Good 11.5% |
| Sudanese | 77.1 /100 | #148 | Good 11.5% |
| Immigrants | Norway | 73.2 /100 | #149 | Good 11.6% |
| Romanians | 72.7 /100 | #150 | Good 11.6% |
| Immigrants | Kenya | 72.1 /100 | #151 | Good 11.6% |
| Immigrants | Moldova | 72.0 /100 | #152 | Good 11.6% |