Comanche vs Nigerian Disability
COMPARE
Comanche
Nigerian
Disability
Disability Comparison
Comanche
Nigerians
14.1%
DISABILITY
0.0/ 100
METRIC RATING
323rd/ 347
METRIC RANK
11.5%
DISABILITY
81.3/ 100
METRIC RATING
145th/ 347
METRIC RANK
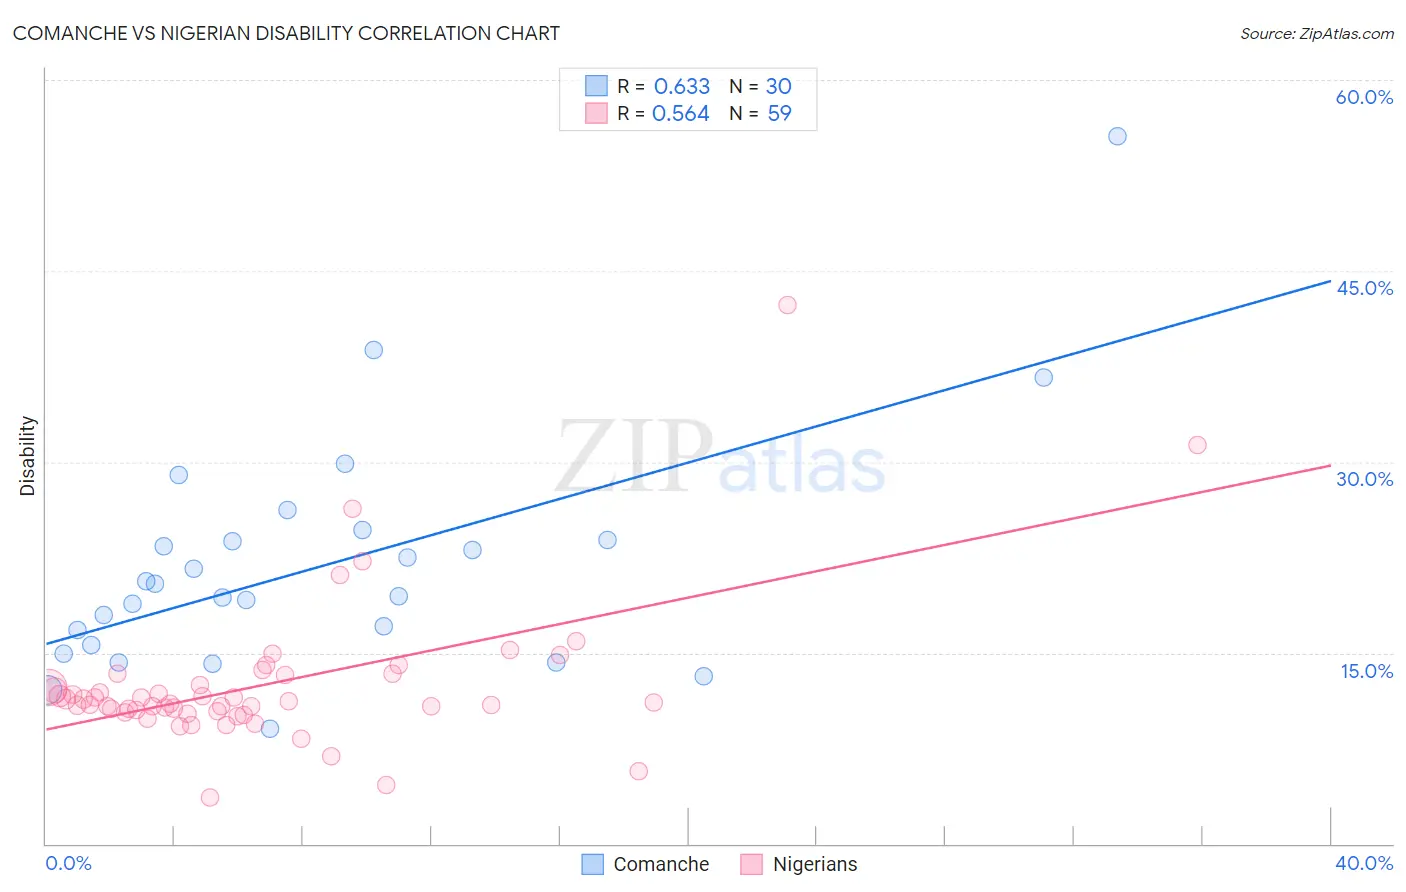
Comanche vs Nigerian Disability Correlation Chart
The statistical analysis conducted on geographies consisting of 109,776,757 people shows a significant positive correlation between the proportion of Comanche and percentage of population with a disability in the United States with a correlation coefficient (R) of 0.633 and weighted average of 14.1%. Similarly, the statistical analysis conducted on geographies consisting of 332,745,371 people shows a substantial positive correlation between the proportion of Nigerians and percentage of population with a disability in the United States with a correlation coefficient (R) of 0.564 and weighted average of 11.5%, a difference of 22.7%.
Disability Correlation Summary
| Measurement | Comanche | Nigerian |
| Minimum | 9.0% | 3.6% |
| Maximum | 55.6% | 42.3% |
| Range | 46.5% | 38.7% |
| Mean | 21.9% | 12.5% |
| Median | 19.9% | 11.1% |
| Interquartile 25% (IQ1) | 15.6% | 10.4% |
| Interquartile 75% (IQ3) | 23.8% | 13.3% |
| Interquartile Range (IQR) | 8.3% | 2.9% |
| Standard Deviation (Sample) | 9.3% | 5.9% |
| Standard Deviation (Population) | 9.1% | 5.8% |
Similar Demographics by Disability
Demographics Similar to Comanche by Disability
In terms of disability, the demographic groups most similar to Comanche are Chippewa (14.1%, a difference of 0.20%), Native/Alaskan (14.2%, a difference of 0.25%), Osage (14.2%, a difference of 0.28%), Ottawa (14.2%, a difference of 0.30%), and Immigrants from the Azores (14.2%, a difference of 0.30%).
| Demographics | Rating | Rank | Disability |
| Pima | 0.0 /100 | #316 | Tragic 13.7% |
| Immigrants | Cabo Verde | 0.0 /100 | #317 | Tragic 13.7% |
| Menominee | 0.0 /100 | #318 | Tragic 13.8% |
| Iroquois | 0.0 /100 | #319 | Tragic 13.8% |
| Apache | 0.0 /100 | #320 | Tragic 13.9% |
| Paiute | 0.0 /100 | #321 | Tragic 13.9% |
| Americans | 0.0 /100 | #322 | Tragic 13.9% |
| Comanche | 0.0 /100 | #323 | Tragic 14.1% |
| Chippewa | 0.0 /100 | #324 | Tragic 14.1% |
| Natives/Alaskans | 0.0 /100 | #325 | Tragic 14.2% |
| Osage | 0.0 /100 | #326 | Tragic 14.2% |
| Ottawa | 0.0 /100 | #327 | Tragic 14.2% |
| Immigrants | Azores | 0.0 /100 | #328 | Tragic 14.2% |
| Potawatomi | 0.0 /100 | #329 | Tragic 14.2% |
| Navajo | 0.0 /100 | #330 | Tragic 14.3% |
Demographics Similar to Nigerians by Disability
In terms of disability, the demographic groups most similar to Nigerians are Australian (11.5%, a difference of 0.090%), Moroccan (11.5%, a difference of 0.15%), Immigrants from Hungary (11.5%, a difference of 0.16%), Immigrants from Ukraine (11.5%, a difference of 0.26%), and Sudanese (11.5%, a difference of 0.29%).
| Demographics | Rating | Rank | Disability |
| New Zealanders | 87.0 /100 | #138 | Excellent 11.5% |
| Ghanaians | 87.0 /100 | #139 | Excellent 11.5% |
| Russians | 86.8 /100 | #140 | Excellent 11.5% |
| Immigrants | Grenada | 86.1 /100 | #141 | Excellent 11.5% |
| Immigrants | Sudan | 85.3 /100 | #142 | Excellent 11.5% |
| Moroccans | 83.3 /100 | #143 | Excellent 11.5% |
| Australians | 82.5 /100 | #144 | Excellent 11.5% |
| Nigerians | 81.3 /100 | #145 | Excellent 11.5% |
| Immigrants | Hungary | 79.0 /100 | #146 | Good 11.5% |
| Immigrants | Ukraine | 77.6 /100 | #147 | Good 11.5% |
| Sudanese | 77.1 /100 | #148 | Good 11.5% |
| Immigrants | Norway | 73.2 /100 | #149 | Good 11.6% |
| Romanians | 72.7 /100 | #150 | Good 11.6% |
| Immigrants | Kenya | 72.1 /100 | #151 | Good 11.6% |
| Immigrants | Moldova | 72.0 /100 | #152 | Good 11.6% |