Finnish vs Nigerian Disability
COMPARE
Finnish
Nigerian
Disability
Disability Comparison
Finns
Nigerians
12.7%
DISABILITY
0.0/ 100
METRIC RATING
273rd/ 347
METRIC RANK
11.5%
DISABILITY
81.3/ 100
METRIC RATING
145th/ 347
METRIC RANK
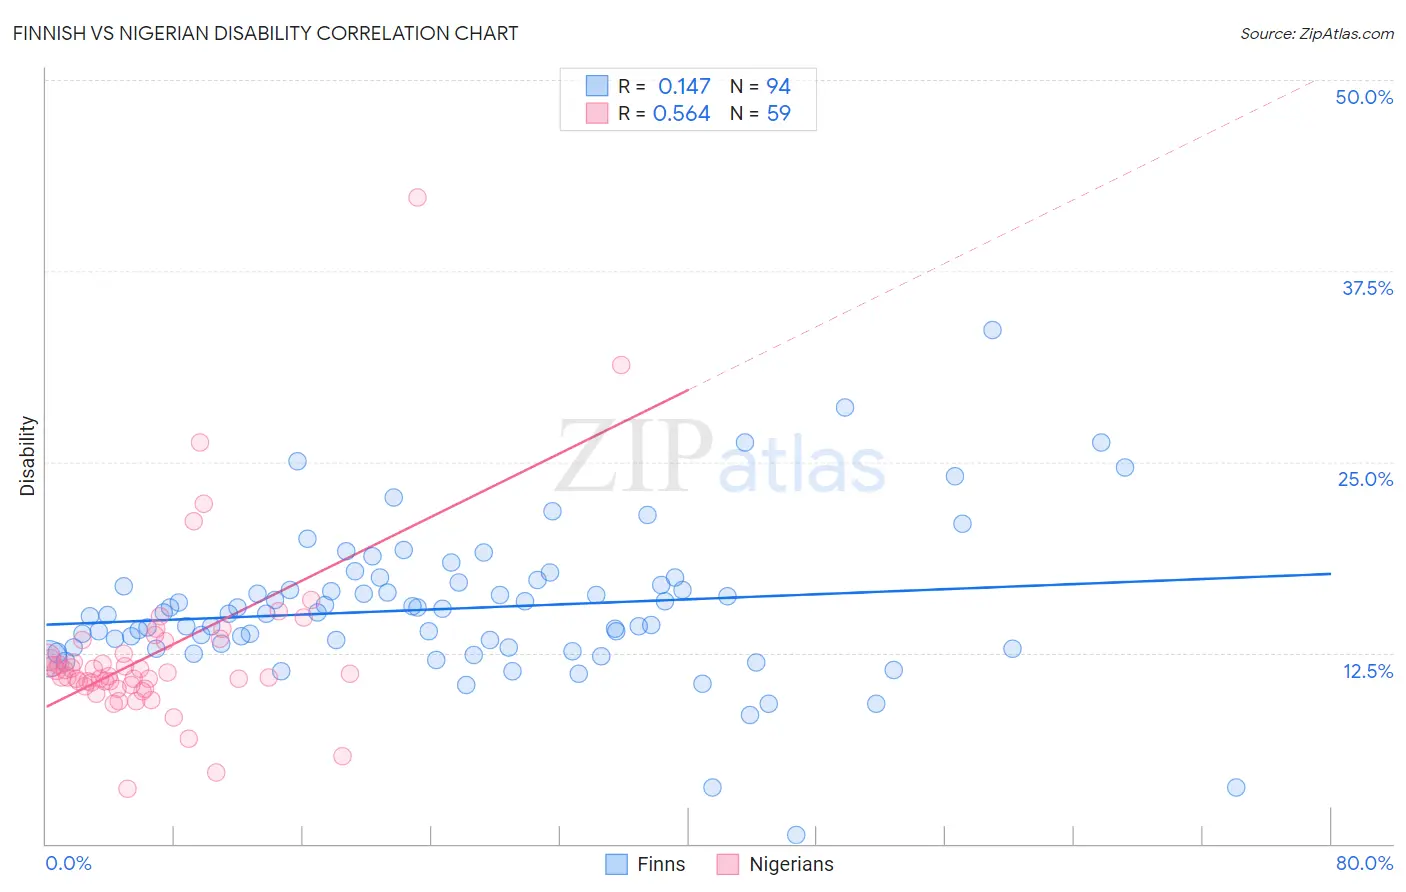
Finnish vs Nigerian Disability Correlation Chart
The statistical analysis conducted on geographies consisting of 404,645,748 people shows a poor positive correlation between the proportion of Finns and percentage of population with a disability in the United States with a correlation coefficient (R) of 0.147 and weighted average of 12.7%. Similarly, the statistical analysis conducted on geographies consisting of 332,745,371 people shows a substantial positive correlation between the proportion of Nigerians and percentage of population with a disability in the United States with a correlation coefficient (R) of 0.564 and weighted average of 11.5%, a difference of 10.4%.
Disability Correlation Summary
| Measurement | Finnish | Nigerian |
| Minimum | 0.58% | 3.6% |
| Maximum | 33.6% | 42.3% |
| Range | 33.1% | 38.7% |
| Mean | 15.4% | 12.5% |
| Median | 15.1% | 11.1% |
| Interquartile 25% (IQ1) | 12.8% | 10.4% |
| Interquartile 75% (IQ3) | 17.0% | 13.3% |
| Interquartile Range (IQR) | 4.2% | 2.9% |
| Standard Deviation (Sample) | 4.8% | 5.9% |
| Standard Deviation (Population) | 4.8% | 5.8% |
Similar Demographics by Disability
Demographics Similar to Finns by Disability
In terms of disability, the demographic groups most similar to Finns are Dominican (12.7%, a difference of 0.16%), Nepalese (12.8%, a difference of 0.43%), Sioux (12.8%, a difference of 0.51%), Immigrants from Yemen (12.6%, a difference of 0.66%), and Hmong (12.8%, a difference of 0.67%).
| Demographics | Rating | Rank | Disability |
| Czechoslovakians | 0.2 /100 | #266 | Tragic 12.5% |
| Spaniards | 0.2 /100 | #267 | Tragic 12.5% |
| Bangladeshis | 0.1 /100 | #268 | Tragic 12.6% |
| Immigrants | Dominican Republic | 0.1 /100 | #269 | Tragic 12.6% |
| Portuguese | 0.1 /100 | #270 | Tragic 12.6% |
| Immigrants | Yemen | 0.1 /100 | #271 | Tragic 12.6% |
| Dominicans | 0.0 /100 | #272 | Tragic 12.7% |
| Finns | 0.0 /100 | #273 | Tragic 12.7% |
| Nepalese | 0.0 /100 | #274 | Tragic 12.8% |
| Sioux | 0.0 /100 | #275 | Tragic 12.8% |
| Hmong | 0.0 /100 | #276 | Tragic 12.8% |
| Dutch | 0.0 /100 | #277 | Tragic 12.8% |
| Germans | 0.0 /100 | #278 | Tragic 12.8% |
| Fijians | 0.0 /100 | #279 | Tragic 12.8% |
| Spanish | 0.0 /100 | #280 | Tragic 12.8% |
Demographics Similar to Nigerians by Disability
In terms of disability, the demographic groups most similar to Nigerians are Australian (11.5%, a difference of 0.090%), Moroccan (11.5%, a difference of 0.15%), Immigrants from Hungary (11.5%, a difference of 0.16%), Immigrants from Ukraine (11.5%, a difference of 0.26%), and Sudanese (11.5%, a difference of 0.29%).
| Demographics | Rating | Rank | Disability |
| New Zealanders | 87.0 /100 | #138 | Excellent 11.5% |
| Ghanaians | 87.0 /100 | #139 | Excellent 11.5% |
| Russians | 86.8 /100 | #140 | Excellent 11.5% |
| Immigrants | Grenada | 86.1 /100 | #141 | Excellent 11.5% |
| Immigrants | Sudan | 85.3 /100 | #142 | Excellent 11.5% |
| Moroccans | 83.3 /100 | #143 | Excellent 11.5% |
| Australians | 82.5 /100 | #144 | Excellent 11.5% |
| Nigerians | 81.3 /100 | #145 | Excellent 11.5% |
| Immigrants | Hungary | 79.0 /100 | #146 | Good 11.5% |
| Immigrants | Ukraine | 77.6 /100 | #147 | Good 11.5% |
| Sudanese | 77.1 /100 | #148 | Good 11.5% |
| Immigrants | Norway | 73.2 /100 | #149 | Good 11.6% |
| Romanians | 72.7 /100 | #150 | Good 11.6% |
| Immigrants | Kenya | 72.1 /100 | #151 | Good 11.6% |
| Immigrants | Moldova | 72.0 /100 | #152 | Good 11.6% |