Inupiat vs Colombian Disability
COMPARE
Inupiat
Colombian
Disability
Disability Comparison
Inupiat
Colombians
12.2%
DISABILITY
2.8/ 100
METRIC RATING
229th/ 347
METRIC RANK
11.0%
DISABILITY
99.6/ 100
METRIC RATING
67th/ 347
METRIC RANK
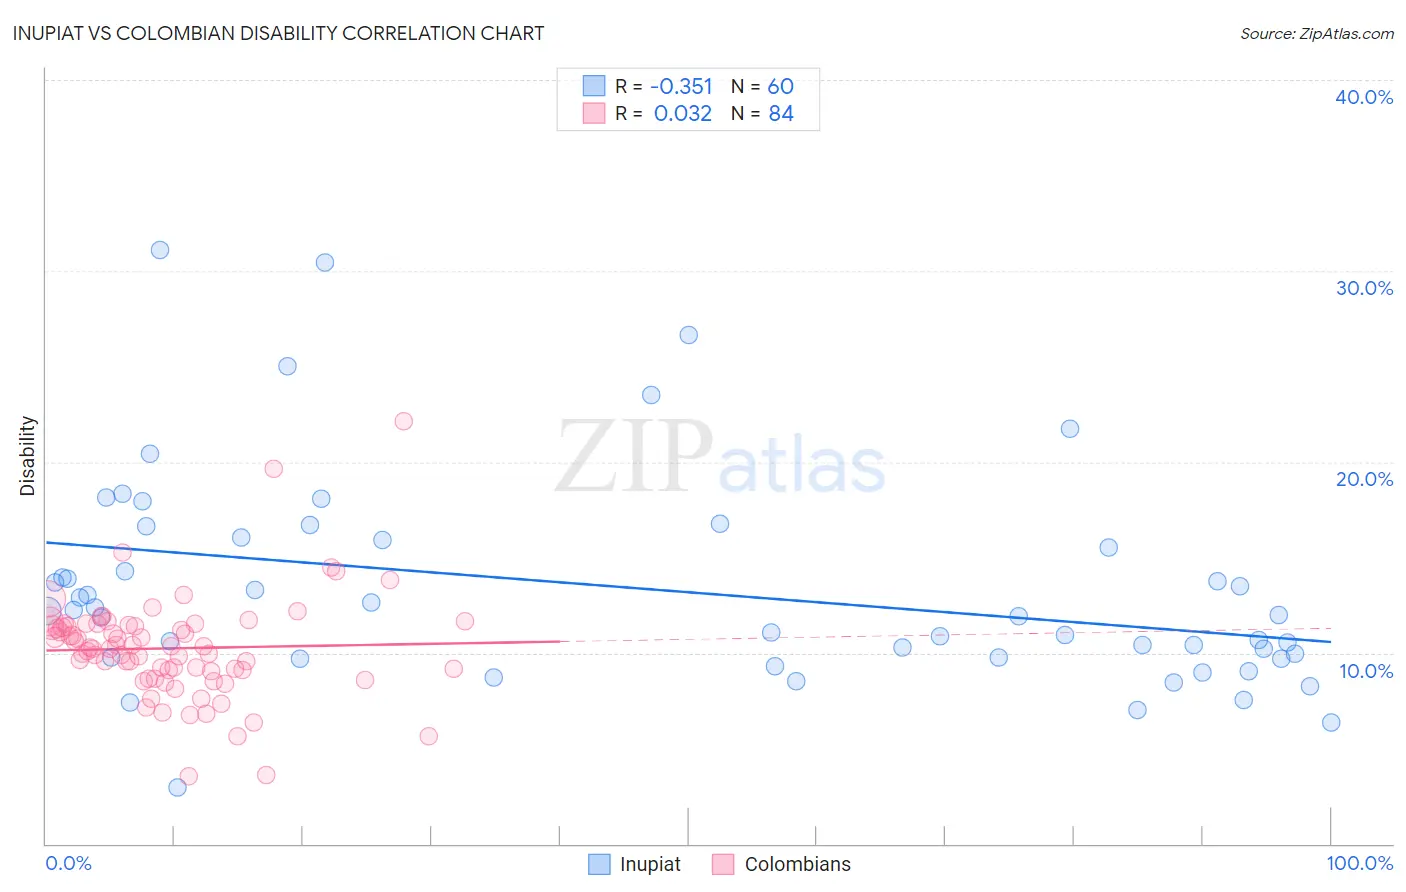
Inupiat vs Colombian Disability Correlation Chart
The statistical analysis conducted on geographies consisting of 96,338,624 people shows a mild negative correlation between the proportion of Inupiat and percentage of population with a disability in the United States with a correlation coefficient (R) of -0.351 and weighted average of 12.2%. Similarly, the statistical analysis conducted on geographies consisting of 419,613,983 people shows no correlation between the proportion of Colombians and percentage of population with a disability in the United States with a correlation coefficient (R) of 0.032 and weighted average of 11.0%, a difference of 10.7%.
Disability Correlation Summary
| Measurement | Inupiat | Colombian |
| Minimum | 2.9% | 3.5% |
| Maximum | 31.1% | 22.2% |
| Range | 28.2% | 18.6% |
| Mean | 13.4% | 10.2% |
| Median | 12.1% | 10.2% |
| Interquartile 25% (IQ1) | 9.8% | 9.1% |
| Interquartile 75% (IQ3) | 16.0% | 11.4% |
| Interquartile Range (IQR) | 6.2% | 2.4% |
| Standard Deviation (Sample) | 5.6% | 2.7% |
| Standard Deviation (Population) | 5.6% | 2.7% |
Similar Demographics by Disability
Demographics Similar to Inupiat by Disability
In terms of disability, the demographic groups most similar to Inupiat are West Indian (12.2%, a difference of 0.020%), Samoan (12.2%, a difference of 0.080%), Malaysian (12.2%, a difference of 0.11%), Italian (12.2%, a difference of 0.12%), and Alsatian (12.1%, a difference of 0.16%).
| Demographics | Rating | Rank | Disability |
| Spanish American Indians | 4.1 /100 | #222 | Tragic 12.1% |
| Hispanics or Latinos | 3.9 /100 | #223 | Tragic 12.1% |
| Mexicans | 3.7 /100 | #224 | Tragic 12.1% |
| Senegalese | 3.5 /100 | #225 | Tragic 12.1% |
| Jamaicans | 3.3 /100 | #226 | Tragic 12.1% |
| Alsatians | 3.3 /100 | #227 | Tragic 12.1% |
| West Indians | 2.9 /100 | #228 | Tragic 12.2% |
| Inupiat | 2.8 /100 | #229 | Tragic 12.2% |
| Samoans | 2.6 /100 | #230 | Tragic 12.2% |
| Malaysians | 2.5 /100 | #231 | Tragic 12.2% |
| Italians | 2.5 /100 | #232 | Tragic 12.2% |
| Bahamians | 2.3 /100 | #233 | Tragic 12.2% |
| Japanese | 2.3 /100 | #234 | Tragic 12.2% |
| Yup'ik | 2.2 /100 | #235 | Tragic 12.2% |
| Chinese | 2.0 /100 | #236 | Tragic 12.2% |
Demographics Similar to Colombians by Disability
In terms of disability, the demographic groups most similar to Colombians are Laotian (11.0%, a difference of 0.080%), Bulgarian (11.0%, a difference of 0.10%), Immigrants from Sweden (11.0%, a difference of 0.11%), Immigrants from Afghanistan (11.0%, a difference of 0.12%), and Immigrants from Eritrea (11.0%, a difference of 0.30%).
| Demographics | Rating | Rank | Disability |
| Zimbabweans | 99.7 /100 | #60 | Exceptional 10.9% |
| Immigrants | Bulgaria | 99.7 /100 | #61 | Exceptional 10.9% |
| Immigrants | Northern Africa | 99.7 /100 | #62 | Exceptional 10.9% |
| Immigrants | Eritrea | 99.7 /100 | #63 | Exceptional 11.0% |
| Immigrants | Sweden | 99.6 /100 | #64 | Exceptional 11.0% |
| Bulgarians | 99.6 /100 | #65 | Exceptional 11.0% |
| Laotians | 99.6 /100 | #66 | Exceptional 11.0% |
| Colombians | 99.6 /100 | #67 | Exceptional 11.0% |
| Immigrants | Afghanistan | 99.6 /100 | #68 | Exceptional 11.0% |
| Sri Lankans | 99.5 /100 | #69 | Exceptional 11.0% |
| Immigrants | France | 99.4 /100 | #70 | Exceptional 11.0% |
| Immigrants | Lebanon | 99.4 /100 | #71 | Exceptional 11.0% |
| Immigrants | Chile | 99.4 /100 | #72 | Exceptional 11.0% |
| Immigrants | Bangladesh | 99.4 /100 | #73 | Exceptional 11.0% |
| Immigrants | Serbia | 99.4 /100 | #74 | Exceptional 11.0% |