Inupiat vs Immigrants from Philippines Disability
COMPARE
Inupiat
Immigrants from Philippines
Disability
Disability Comparison
Inupiat
Immigrants from Philippines
12.2%
DISABILITY
2.8/ 100
METRIC RATING
229th/ 347
METRIC RANK
11.3%
DISABILITY
94.6/ 100
METRIC RATING
115th/ 347
METRIC RANK
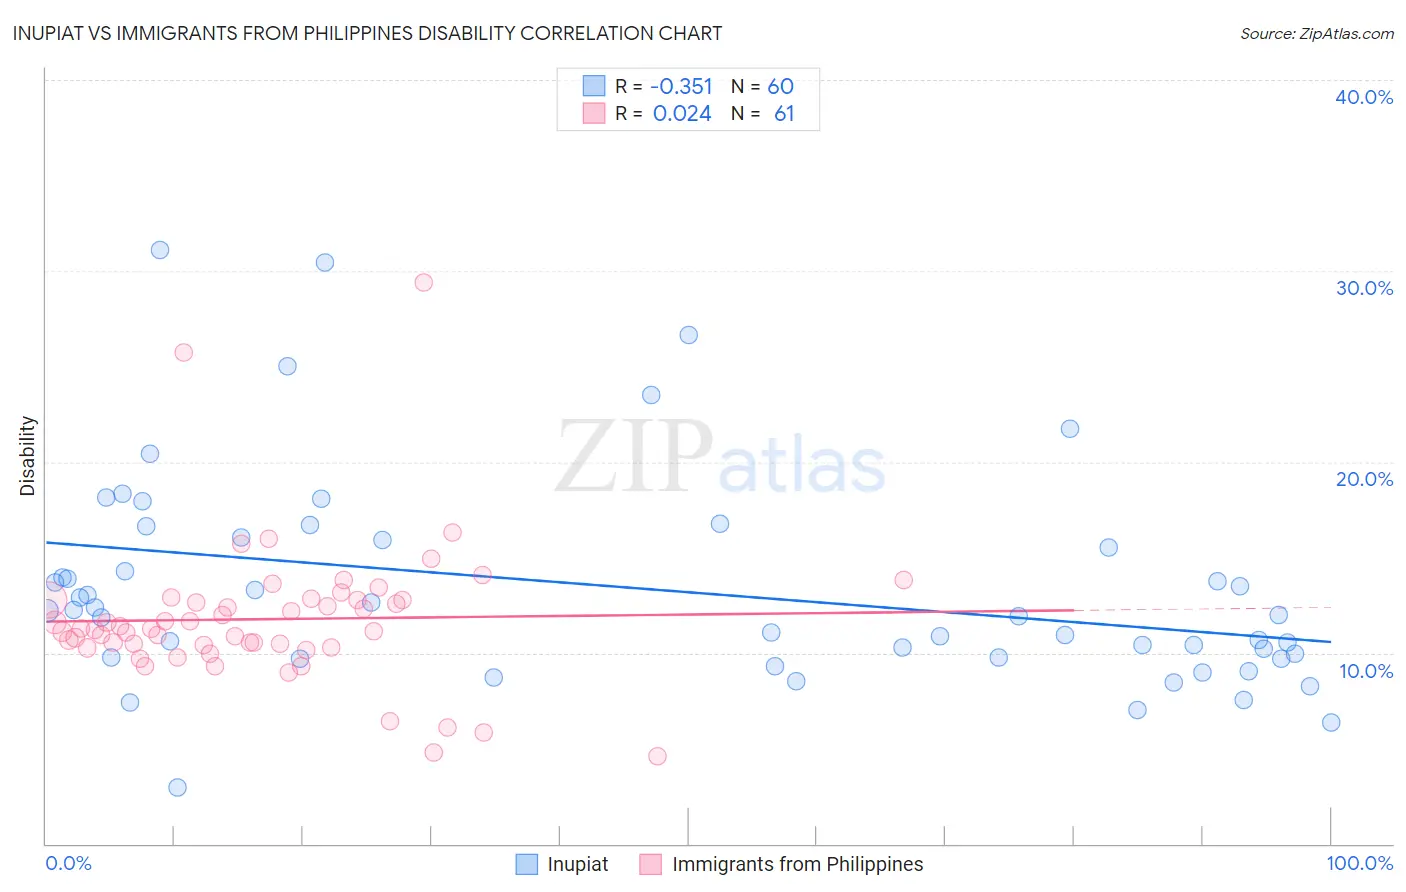
Inupiat vs Immigrants from Philippines Disability Correlation Chart
The statistical analysis conducted on geographies consisting of 96,338,624 people shows a mild negative correlation between the proportion of Inupiat and percentage of population with a disability in the United States with a correlation coefficient (R) of -0.351 and weighted average of 12.2%. Similarly, the statistical analysis conducted on geographies consisting of 471,195,487 people shows no correlation between the proportion of Immigrants from Philippines and percentage of population with a disability in the United States with a correlation coefficient (R) of 0.024 and weighted average of 11.3%, a difference of 7.3%.
Disability Correlation Summary
| Measurement | Inupiat | Immigrants from Philippines |
| Minimum | 2.9% | 4.6% |
| Maximum | 31.1% | 29.4% |
| Range | 28.2% | 24.8% |
| Mean | 13.4% | 11.8% |
| Median | 12.1% | 11.3% |
| Interquartile 25% (IQ1) | 9.8% | 10.4% |
| Interquartile 75% (IQ3) | 16.0% | 12.8% |
| Interquartile Range (IQR) | 6.2% | 2.4% |
| Standard Deviation (Sample) | 5.6% | 3.8% |
| Standard Deviation (Population) | 5.6% | 3.8% |
Similar Demographics by Disability
Demographics Similar to Inupiat by Disability
In terms of disability, the demographic groups most similar to Inupiat are West Indian (12.2%, a difference of 0.020%), Samoan (12.2%, a difference of 0.080%), Malaysian (12.2%, a difference of 0.11%), Italian (12.2%, a difference of 0.12%), and Alsatian (12.1%, a difference of 0.16%).
| Demographics | Rating | Rank | Disability |
| Spanish American Indians | 4.1 /100 | #222 | Tragic 12.1% |
| Hispanics or Latinos | 3.9 /100 | #223 | Tragic 12.1% |
| Mexicans | 3.7 /100 | #224 | Tragic 12.1% |
| Senegalese | 3.5 /100 | #225 | Tragic 12.1% |
| Jamaicans | 3.3 /100 | #226 | Tragic 12.1% |
| Alsatians | 3.3 /100 | #227 | Tragic 12.1% |
| West Indians | 2.9 /100 | #228 | Tragic 12.2% |
| Inupiat | 2.8 /100 | #229 | Tragic 12.2% |
| Samoans | 2.6 /100 | #230 | Tragic 12.2% |
| Malaysians | 2.5 /100 | #231 | Tragic 12.2% |
| Italians | 2.5 /100 | #232 | Tragic 12.2% |
| Bahamians | 2.3 /100 | #233 | Tragic 12.2% |
| Japanese | 2.3 /100 | #234 | Tragic 12.2% |
| Yup'ik | 2.2 /100 | #235 | Tragic 12.2% |
| Chinese | 2.0 /100 | #236 | Tragic 12.2% |
Demographics Similar to Immigrants from Philippines by Disability
In terms of disability, the demographic groups most similar to Immigrants from Philippines are Immigrants from Syria (11.3%, a difference of 0.010%), Guyanese (11.3%, a difference of 0.020%), Immigrants from Uzbekistan (11.3%, a difference of 0.060%), Immigrants from Northern Europe (11.3%, a difference of 0.11%), and Luxembourger (11.3%, a difference of 0.17%).
| Demographics | Rating | Rank | Disability |
| Immigrants | Nigeria | 96.0 /100 | #108 | Exceptional 11.3% |
| Immigrants | Uganda | 95.7 /100 | #109 | Exceptional 11.3% |
| Immigrants | Denmark | 95.6 /100 | #110 | Exceptional 11.3% |
| Immigrants | South Eastern Asia | 95.4 /100 | #111 | Exceptional 11.3% |
| Immigrants | Uzbekistan | 94.9 /100 | #112 | Exceptional 11.3% |
| Guyanese | 94.7 /100 | #113 | Exceptional 11.3% |
| Immigrants | Syria | 94.7 /100 | #114 | Exceptional 11.3% |
| Immigrants | Philippines | 94.6 /100 | #115 | Exceptional 11.3% |
| Immigrants | Northern Europe | 94.1 /100 | #116 | Exceptional 11.3% |
| Luxembourgers | 93.9 /100 | #117 | Exceptional 11.3% |
| Koreans | 93.8 /100 | #118 | Exceptional 11.3% |
| Central Americans | 93.5 /100 | #119 | Exceptional 11.4% |
| Immigrants | North Macedonia | 93.5 /100 | #120 | Exceptional 11.4% |
| Immigrants | Costa Rica | 93.4 /100 | #121 | Exceptional 11.4% |
| Brazilians | 93.3 /100 | #122 | Exceptional 11.4% |