Immigrants from North America vs Bermudan Disability Age 5 to 17
COMPARE
Immigrants from North America
Bermudan
Disability Age 5 to 17
Disability Age 5 to 17 Comparison
Immigrants from North America
Bermudans
5.7%
DISABILITY AGE 5 TO 17
23.1/ 100
METRIC RATING
197th/ 347
METRIC RANK
6.4%
DISABILITY AGE 5 TO 17
0.0/ 100
METRIC RATING
312th/ 347
METRIC RANK
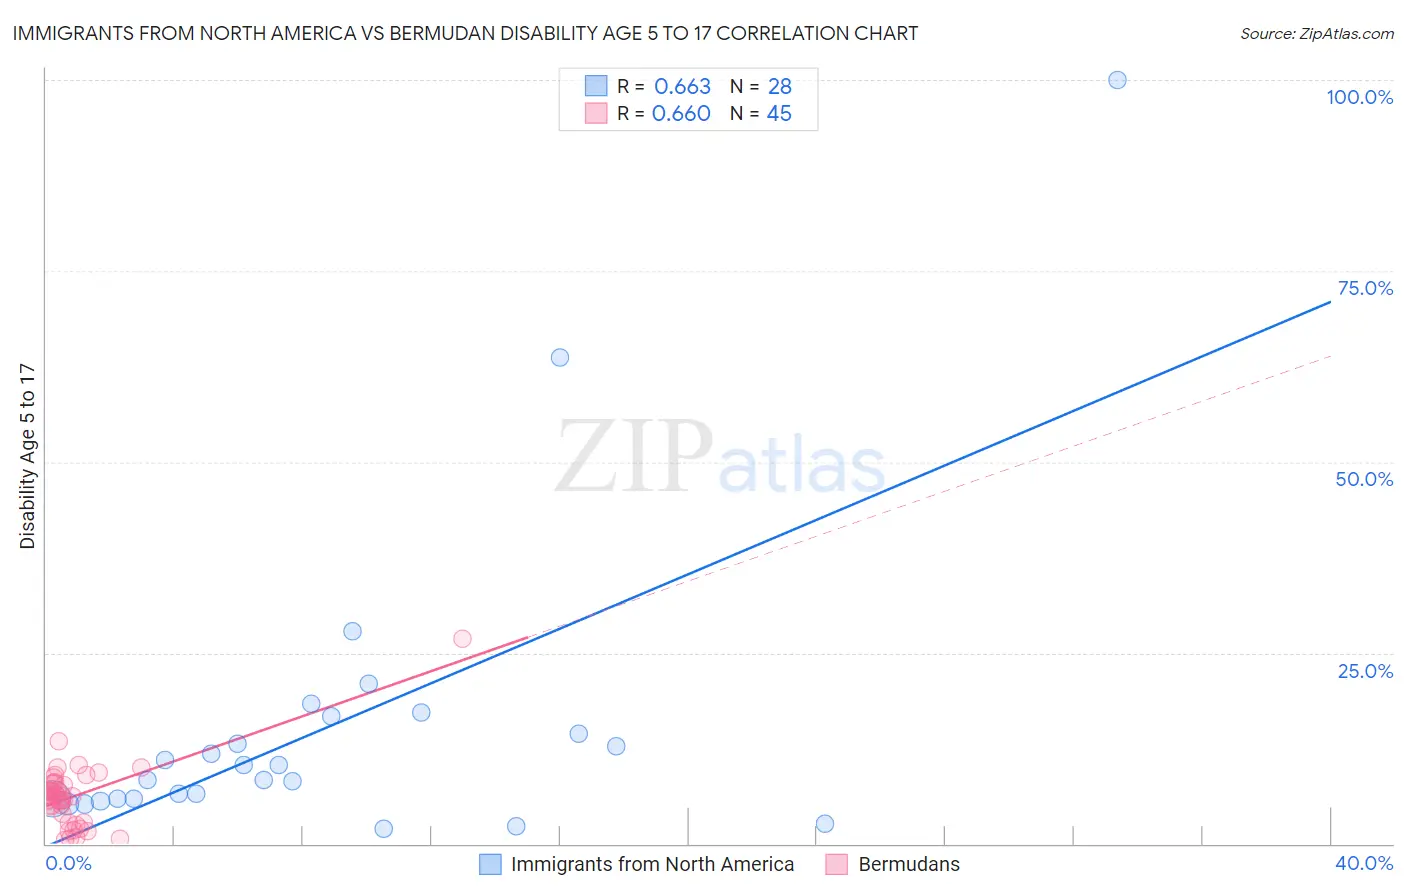
Immigrants from North America vs Bermudan Disability Age 5 to 17 Correlation Chart
The statistical analysis conducted on geographies consisting of 456,706,371 people shows a significant positive correlation between the proportion of Immigrants from North America and percentage of population with a disability between the ages 5 and 17 in the United States with a correlation coefficient (R) of 0.663 and weighted average of 5.7%. Similarly, the statistical analysis conducted on geographies consisting of 55,645,998 people shows a significant positive correlation between the proportion of Bermudans and percentage of population with a disability between the ages 5 and 17 in the United States with a correlation coefficient (R) of 0.660 and weighted average of 6.4%, a difference of 11.8%.
Disability Age 5 to 17 Correlation Summary
| Measurement | Immigrants from North America | Bermudan |
| Minimum | 1.9% | 0.50% |
| Maximum | 100.0% | 26.8% |
| Range | 98.1% | 26.3% |
| Mean | 15.2% | 6.2% |
| Median | 9.3% | 6.2% |
| Interquartile 25% (IQ1) | 5.9% | 3.3% |
| Interquartile 75% (IQ3) | 15.6% | 7.9% |
| Interquartile Range (IQR) | 9.7% | 4.5% |
| Standard Deviation (Sample) | 20.3% | 4.3% |
| Standard Deviation (Population) | 20.0% | 4.3% |
Similar Demographics by Disability Age 5 to 17
Demographics Similar to Immigrants from North America by Disability Age 5 to 17
In terms of disability age 5 to 17, the demographic groups most similar to Immigrants from North America are Inupiat (5.7%, a difference of 0.010%), Immigrants from Nigeria (5.7%, a difference of 0.020%), Croatian (5.7%, a difference of 0.030%), Norwegian (5.7%, a difference of 0.16%), and Immigrants from Canada (5.7%, a difference of 0.19%).
| Demographics | Rating | Rank | Disability Age 5 to 17 |
| Immigrants | Eastern Africa | 27.3 /100 | #190 | Fair 5.7% |
| Danes | 26.5 /100 | #191 | Fair 5.7% |
| Immigrants | Bosnia and Herzegovina | 26.3 /100 | #192 | Fair 5.7% |
| Immigrants | Canada | 26.1 /100 | #193 | Fair 5.7% |
| Croatians | 23.6 /100 | #194 | Fair 5.7% |
| Immigrants | Nigeria | 23.4 /100 | #195 | Fair 5.7% |
| Inupiat | 23.3 /100 | #196 | Fair 5.7% |
| Immigrants | North America | 23.1 /100 | #197 | Fair 5.7% |
| Norwegians | 20.9 /100 | #198 | Fair 5.7% |
| Northern Europeans | 15.2 /100 | #199 | Poor 5.7% |
| Icelanders | 14.6 /100 | #200 | Poor 5.7% |
| Basques | 13.7 /100 | #201 | Poor 5.7% |
| Austrians | 13.2 /100 | #202 | Poor 5.7% |
| Spanish American Indians | 12.8 /100 | #203 | Poor 5.7% |
| Paiute | 11.2 /100 | #204 | Poor 5.7% |
Demographics Similar to Bermudans by Disability Age 5 to 17
In terms of disability age 5 to 17, the demographic groups most similar to Bermudans are Immigrants from Dominica (6.3%, a difference of 0.12%), Alaskan Athabascan (6.3%, a difference of 0.16%), Hmong (6.3%, a difference of 0.29%), Scotch-Irish (6.3%, a difference of 0.32%), and Apache (6.4%, a difference of 0.38%).
| Demographics | Rating | Rank | Disability Age 5 to 17 |
| Natives/Alaskans | 0.0 /100 | #305 | Tragic 6.3% |
| Immigrants | Nonimmigrants | 0.0 /100 | #306 | Tragic 6.3% |
| Bahamians | 0.0 /100 | #307 | Tragic 6.3% |
| Scotch-Irish | 0.0 /100 | #308 | Tragic 6.3% |
| Hmong | 0.0 /100 | #309 | Tragic 6.3% |
| Alaskan Athabascans | 0.0 /100 | #310 | Tragic 6.3% |
| Immigrants | Dominica | 0.0 /100 | #311 | Tragic 6.3% |
| Bermudans | 0.0 /100 | #312 | Tragic 6.4% |
| Apache | 0.0 /100 | #313 | Tragic 6.4% |
| French | 0.0 /100 | #314 | Tragic 6.4% |
| Immigrants | Portugal | 0.0 /100 | #315 | Tragic 6.4% |
| Immigrants | Dominican Republic | 0.0 /100 | #316 | Tragic 6.4% |
| Kiowa | 0.0 /100 | #317 | Tragic 6.4% |
| Comanche | 0.0 /100 | #318 | Tragic 6.4% |
| Delaware | 0.0 /100 | #319 | Tragic 6.5% |