Immigrants from the Azores vs Bermudan Disability Age 5 to 17
COMPARE
Immigrants from the Azores
Bermudan
Disability Age 5 to 17
Disability Age 5 to 17 Comparison
Immigrants from the Azores
Bermudans
6.7%
DISABILITY AGE 5 TO 17
0.0/ 100
METRIC RATING
332nd/ 347
METRIC RANK
6.4%
DISABILITY AGE 5 TO 17
0.0/ 100
METRIC RATING
312th/ 347
METRIC RANK
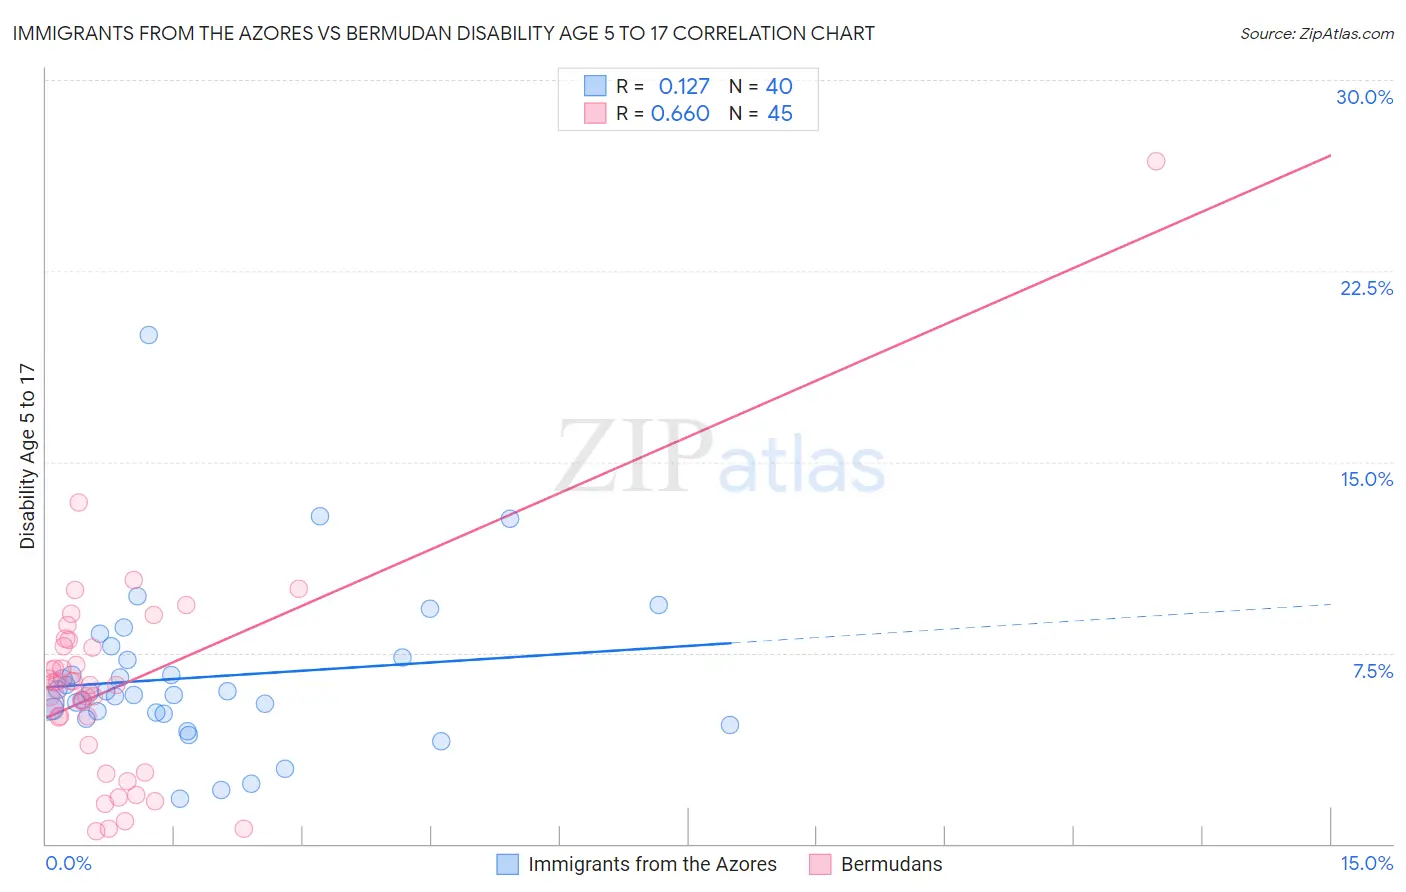
Immigrants from the Azores vs Bermudan Disability Age 5 to 17 Correlation Chart
The statistical analysis conducted on geographies consisting of 46,157,711 people shows a poor positive correlation between the proportion of Immigrants from the Azores and percentage of population with a disability between the ages 5 and 17 in the United States with a correlation coefficient (R) of 0.127 and weighted average of 6.7%. Similarly, the statistical analysis conducted on geographies consisting of 55,645,998 people shows a significant positive correlation between the proportion of Bermudans and percentage of population with a disability between the ages 5 and 17 in the United States with a correlation coefficient (R) of 0.660 and weighted average of 6.4%, a difference of 5.7%.
Disability Age 5 to 17 Correlation Summary
| Measurement | Immigrants from the Azores | Bermudan |
| Minimum | 1.8% | 0.50% |
| Maximum | 20.0% | 26.8% |
| Range | 18.2% | 26.3% |
| Mean | 6.5% | 6.2% |
| Median | 5.9% | 6.2% |
| Interquartile 25% (IQ1) | 5.1% | 3.3% |
| Interquartile 75% (IQ3) | 7.3% | 7.9% |
| Interquartile Range (IQR) | 2.1% | 4.5% |
| Standard Deviation (Sample) | 3.2% | 4.3% |
| Standard Deviation (Population) | 3.2% | 4.3% |
Demographics Similar to Immigrants from the Azores and Bermudans by Disability Age 5 to 17
In terms of disability age 5 to 17, the demographic groups most similar to Immigrants from the Azores are French Canadian (6.7%, a difference of 0.020%), Dutch West Indian (6.7%, a difference of 0.10%), Blackfeet (6.6%, a difference of 1.9%), Pennsylvania German (6.6%, a difference of 2.1%), and French American Indian (6.6%, a difference of 2.3%). Similarly, the demographic groups most similar to Bermudans are Apache (6.4%, a difference of 0.38%), French (6.4%, a difference of 0.89%), Immigrants from Portugal (6.4%, a difference of 1.1%), Immigrants from Dominican Republic (6.4%, a difference of 1.3%), and Kiowa (6.4%, a difference of 1.4%).
| Demographics | Rating | Rank | Disability Age 5 to 17 |
| Bermudans | 0.0 /100 | #312 | Tragic 6.4% |
| Apache | 0.0 /100 | #313 | Tragic 6.4% |
| French | 0.0 /100 | #314 | Tragic 6.4% |
| Immigrants | Portugal | 0.0 /100 | #315 | Tragic 6.4% |
| Immigrants | Dominican Republic | 0.0 /100 | #316 | Tragic 6.4% |
| Kiowa | 0.0 /100 | #317 | Tragic 6.4% |
| Comanche | 0.0 /100 | #318 | Tragic 6.4% |
| Delaware | 0.0 /100 | #319 | Tragic 6.5% |
| Africans | 0.0 /100 | #320 | Tragic 6.5% |
| Tohono O'odham | 0.0 /100 | #321 | Tragic 6.5% |
| Slovaks | 0.0 /100 | #322 | Tragic 6.5% |
| Osage | 0.0 /100 | #323 | Tragic 6.5% |
| Dominicans | 0.0 /100 | #324 | Tragic 6.5% |
| Americans | 0.0 /100 | #325 | Tragic 6.5% |
| Potawatomi | 0.0 /100 | #326 | Tragic 6.5% |
| French American Indians | 0.0 /100 | #327 | Tragic 6.6% |
| Pennsylvania Germans | 0.0 /100 | #328 | Tragic 6.6% |
| Blackfeet | 0.0 /100 | #329 | Tragic 6.6% |
| Dutch West Indians | 0.0 /100 | #330 | Tragic 6.7% |
| French Canadians | 0.0 /100 | #331 | Tragic 6.7% |
| Immigrants | Azores | 0.0 /100 | #332 | Tragic 6.7% |