Immigrants from Trinidad and Tobago vs Welsh Male Disability
COMPARE
Immigrants from Trinidad and Tobago
Welsh
Male Disability
Male Disability Comparison
Immigrants from Trinidad and Tobago
Welsh
10.9%
MALE DISABILITY
86.9/ 100
METRIC RATING
126th/ 347
METRIC RANK
12.7%
MALE DISABILITY
0.0/ 100
METRIC RATING
285th/ 347
METRIC RANK
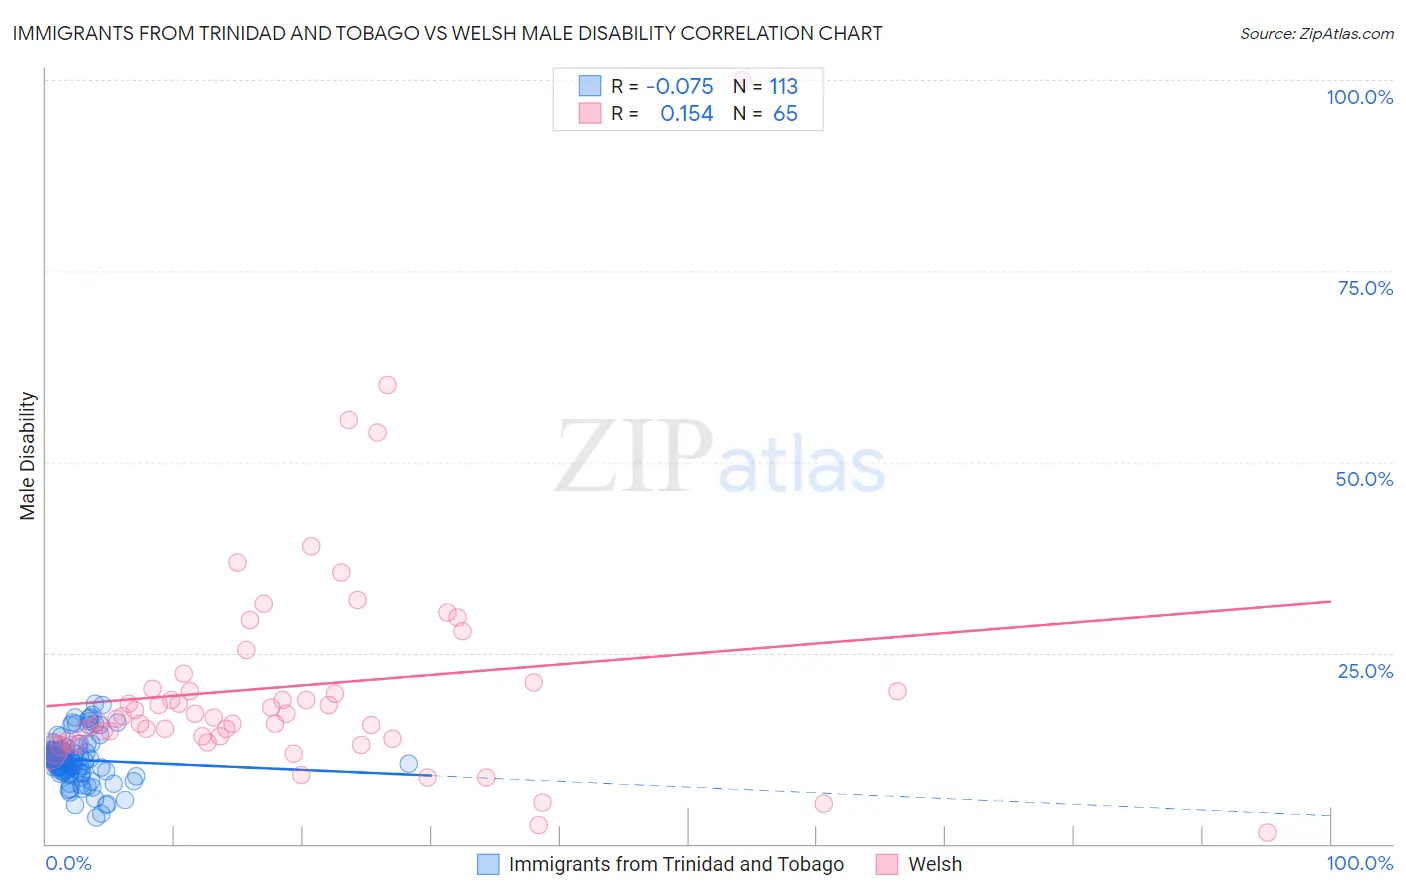
Immigrants from Trinidad and Tobago vs Welsh Male Disability Correlation Chart
The statistical analysis conducted on geographies consisting of 223,502,248 people shows a slight negative correlation between the proportion of Immigrants from Trinidad and Tobago and percentage of males with a disability in the United States with a correlation coefficient (R) of -0.075 and weighted average of 10.9%. Similarly, the statistical analysis conducted on geographies consisting of 528,469,982 people shows a poor positive correlation between the proportion of Welsh and percentage of males with a disability in the United States with a correlation coefficient (R) of 0.154 and weighted average of 12.7%, a difference of 16.7%.
Male Disability Correlation Summary
| Measurement | Immigrants from Trinidad and Tobago | Welsh |
| Minimum | 3.4% | 1.4% |
| Maximum | 18.4% | 100.0% |
| Range | 14.9% | 98.6% |
| Mean | 11.0% | 20.6% |
| Median | 11.1% | 16.6% |
| Interquartile 25% (IQ1) | 9.5% | 13.5% |
| Interquartile 75% (IQ3) | 12.2% | 20.7% |
| Interquartile Range (IQR) | 2.7% | 7.1% |
| Standard Deviation (Sample) | 2.9% | 15.0% |
| Standard Deviation (Population) | 2.9% | 14.8% |
Similar Demographics by Male Disability
Demographics Similar to Immigrants from Trinidad and Tobago by Male Disability
In terms of male disability, the demographic groups most similar to Immigrants from Trinidad and Tobago are Immigrants from Ukraine (10.9%, a difference of 0.010%), South American Indian (10.9%, a difference of 0.16%), Immigrants from North Macedonia (10.9%, a difference of 0.16%), Immigrants from Latvia (10.9%, a difference of 0.17%), and Immigrants from Philippines (10.9%, a difference of 0.17%).
| Demographics | Rating | Rank | Male Disability |
| Armenians | 90.1 /100 | #119 | Exceptional 10.9% |
| Immigrants | Africa | 89.4 /100 | #120 | Excellent 10.9% |
| Immigrants | South Eastern Asia | 89.2 /100 | #121 | Excellent 10.9% |
| Immigrants | Ghana | 89.0 /100 | #122 | Excellent 10.9% |
| Immigrants | Czechoslovakia | 88.4 /100 | #123 | Excellent 10.9% |
| South American Indians | 88.1 /100 | #124 | Excellent 10.9% |
| Immigrants | North Macedonia | 88.1 /100 | #125 | Excellent 10.9% |
| Immigrants | Trinidad and Tobago | 86.9 /100 | #126 | Excellent 10.9% |
| Immigrants | Ukraine | 86.8 /100 | #127 | Excellent 10.9% |
| Immigrants | Latvia | 85.5 /100 | #128 | Excellent 10.9% |
| Immigrants | Philippines | 85.4 /100 | #129 | Excellent 10.9% |
| Brazilians | 85.4 /100 | #130 | Excellent 10.9% |
| Macedonians | 84.2 /100 | #131 | Excellent 11.0% |
| Immigrants | Fiji | 84.0 /100 | #132 | Excellent 11.0% |
| Ugandans | 83.9 /100 | #133 | Excellent 11.0% |
Demographics Similar to Welsh by Male Disability
In terms of male disability, the demographic groups most similar to Welsh are Spanish (12.7%, a difference of 0.0%), Scottish (12.8%, a difference of 0.050%), Cape Verdean (12.8%, a difference of 0.12%), German (12.7%, a difference of 0.27%), and Irish (12.7%, a difference of 0.28%).
| Demographics | Rating | Rank | Male Disability |
| Central American Indians | 0.0 /100 | #278 | Tragic 12.7% |
| Slovaks | 0.0 /100 | #279 | Tragic 12.7% |
| Dutch | 0.0 /100 | #280 | Tragic 12.7% |
| Sioux | 0.0 /100 | #281 | Tragic 12.7% |
| Irish | 0.0 /100 | #282 | Tragic 12.7% |
| Germans | 0.0 /100 | #283 | Tragic 12.7% |
| Spanish | 0.0 /100 | #284 | Tragic 12.7% |
| Welsh | 0.0 /100 | #285 | Tragic 12.7% |
| Scottish | 0.0 /100 | #286 | Tragic 12.8% |
| Cape Verdeans | 0.0 /100 | #287 | Tragic 12.8% |
| Yup'ik | 0.0 /100 | #288 | Tragic 12.8% |
| Immigrants | Cabo Verde | 0.0 /100 | #289 | Tragic 12.8% |
| Pima | 0.0 /100 | #290 | Tragic 12.8% |
| Whites/Caucasians | 0.0 /100 | #291 | Tragic 12.8% |
| English | 0.0 /100 | #292 | Tragic 12.8% |