Immigrants from Trinidad and Tobago vs Immigrants from Bulgaria Male Disability
COMPARE
Immigrants from Trinidad and Tobago
Immigrants from Bulgaria
Male Disability
Male Disability Comparison
Immigrants from Trinidad and Tobago
Immigrants from Bulgaria
10.9%
MALE DISABILITY
86.9/ 100
METRIC RATING
126th/ 347
METRIC RANK
10.5%
MALE DISABILITY
99.1/ 100
METRIC RATING
70th/ 347
METRIC RANK
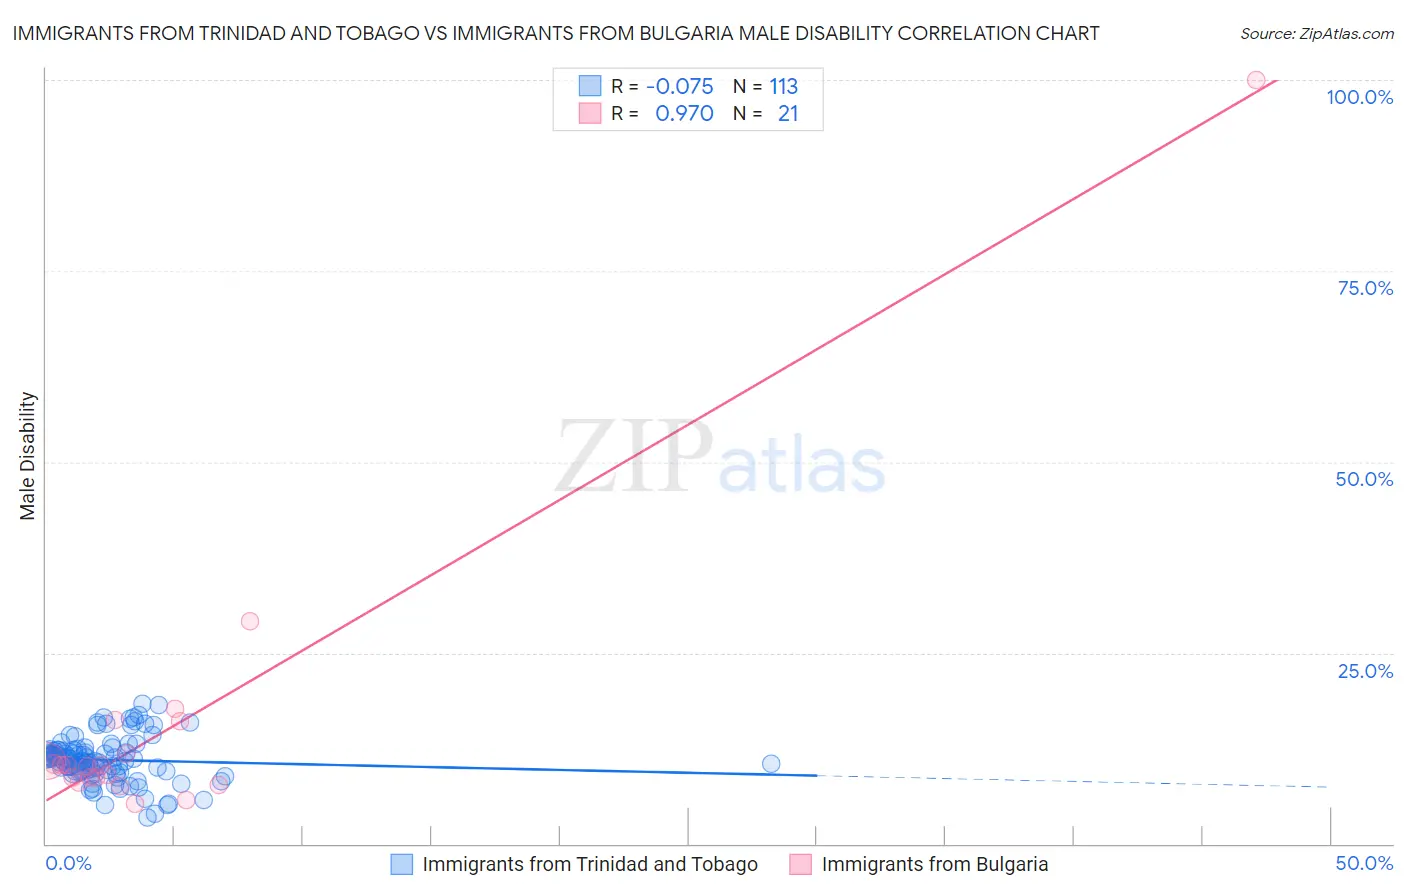
Immigrants from Trinidad and Tobago vs Immigrants from Bulgaria Male Disability Correlation Chart
The statistical analysis conducted on geographies consisting of 223,502,248 people shows a slight negative correlation between the proportion of Immigrants from Trinidad and Tobago and percentage of males with a disability in the United States with a correlation coefficient (R) of -0.075 and weighted average of 10.9%. Similarly, the statistical analysis conducted on geographies consisting of 172,550,350 people shows a perfect positive correlation between the proportion of Immigrants from Bulgaria and percentage of males with a disability in the United States with a correlation coefficient (R) of 0.970 and weighted average of 10.5%, a difference of 4.2%.
Male Disability Correlation Summary
| Measurement | Immigrants from Trinidad and Tobago | Immigrants from Bulgaria |
| Minimum | 3.4% | 5.2% |
| Maximum | 18.4% | 100.0% |
| Range | 14.9% | 94.8% |
| Mean | 11.0% | 15.4% |
| Median | 11.1% | 10.3% |
| Interquartile 25% (IQ1) | 9.5% | 8.3% |
| Interquartile 75% (IQ3) | 12.2% | 14.0% |
| Interquartile Range (IQR) | 2.7% | 5.7% |
| Standard Deviation (Sample) | 2.9% | 20.1% |
| Standard Deviation (Population) | 2.9% | 19.6% |
Similar Demographics by Male Disability
Demographics Similar to Immigrants from Trinidad and Tobago by Male Disability
In terms of male disability, the demographic groups most similar to Immigrants from Trinidad and Tobago are Immigrants from Ukraine (10.9%, a difference of 0.010%), South American Indian (10.9%, a difference of 0.16%), Immigrants from North Macedonia (10.9%, a difference of 0.16%), Immigrants from Latvia (10.9%, a difference of 0.17%), and Immigrants from Philippines (10.9%, a difference of 0.17%).
| Demographics | Rating | Rank | Male Disability |
| Armenians | 90.1 /100 | #119 | Exceptional 10.9% |
| Immigrants | Africa | 89.4 /100 | #120 | Excellent 10.9% |
| Immigrants | South Eastern Asia | 89.2 /100 | #121 | Excellent 10.9% |
| Immigrants | Ghana | 89.0 /100 | #122 | Excellent 10.9% |
| Immigrants | Czechoslovakia | 88.4 /100 | #123 | Excellent 10.9% |
| South American Indians | 88.1 /100 | #124 | Excellent 10.9% |
| Immigrants | North Macedonia | 88.1 /100 | #125 | Excellent 10.9% |
| Immigrants | Trinidad and Tobago | 86.9 /100 | #126 | Excellent 10.9% |
| Immigrants | Ukraine | 86.8 /100 | #127 | Excellent 10.9% |
| Immigrants | Latvia | 85.5 /100 | #128 | Excellent 10.9% |
| Immigrants | Philippines | 85.4 /100 | #129 | Excellent 10.9% |
| Brazilians | 85.4 /100 | #130 | Excellent 10.9% |
| Macedonians | 84.2 /100 | #131 | Excellent 11.0% |
| Immigrants | Fiji | 84.0 /100 | #132 | Excellent 11.0% |
| Ugandans | 83.9 /100 | #133 | Excellent 11.0% |
Demographics Similar to Immigrants from Bulgaria by Male Disability
In terms of male disability, the demographic groups most similar to Immigrants from Bulgaria are Colombian (10.5%, a difference of 0.14%), Ecuadorian (10.5%, a difference of 0.14%), Immigrants from Cameroon (10.5%, a difference of 0.15%), Immigrants from Serbia (10.5%, a difference of 0.20%), and Immigrants from Afghanistan (10.5%, a difference of 0.24%).
| Demographics | Rating | Rank | Male Disability |
| Immigrants | Belarus | 99.3 /100 | #63 | Exceptional 10.4% |
| Jordanians | 99.3 /100 | #64 | Exceptional 10.5% |
| Immigrants | Grenada | 99.2 /100 | #65 | Exceptional 10.5% |
| Guyanese | 99.2 /100 | #66 | Exceptional 10.5% |
| Immigrants | Afghanistan | 99.2 /100 | #67 | Exceptional 10.5% |
| Colombians | 99.2 /100 | #68 | Exceptional 10.5% |
| Ecuadorians | 99.2 /100 | #69 | Exceptional 10.5% |
| Immigrants | Bulgaria | 99.1 /100 | #70 | Exceptional 10.5% |
| Immigrants | Cameroon | 99.0 /100 | #71 | Exceptional 10.5% |
| Immigrants | Serbia | 99.0 /100 | #72 | Exceptional 10.5% |
| Immigrants | Lithuania | 98.9 /100 | #73 | Exceptional 10.5% |
| Immigrants | Lebanon | 98.8 /100 | #74 | Exceptional 10.5% |
| Sierra Leoneans | 98.7 /100 | #75 | Exceptional 10.5% |
| Immigrants | Sierra Leone | 98.7 /100 | #76 | Exceptional 10.5% |
| Laotians | 98.6 /100 | #77 | Exceptional 10.6% |