Subsaharan African vs Welsh Male Disability
COMPARE
Subsaharan African
Welsh
Male Disability
Male Disability Comparison
Sub-Saharan Africans
Welsh
11.8%
MALE DISABILITY
2.8/ 100
METRIC RATING
226th/ 347
METRIC RANK
12.7%
MALE DISABILITY
0.0/ 100
METRIC RATING
285th/ 347
METRIC RANK
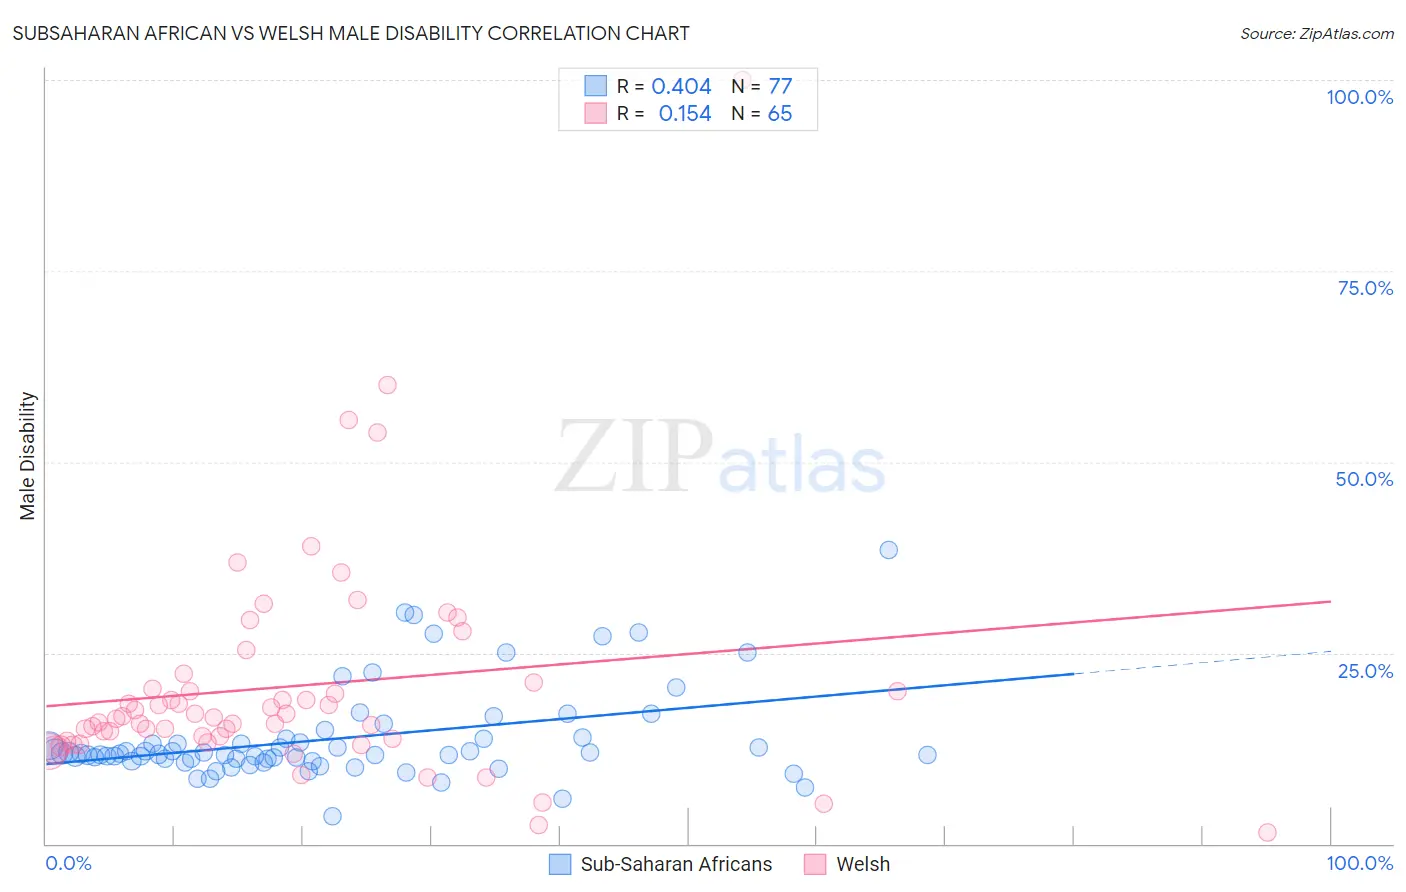
Subsaharan African vs Welsh Male Disability Correlation Chart
The statistical analysis conducted on geographies consisting of 508,010,863 people shows a moderate positive correlation between the proportion of Sub-Saharan Africans and percentage of males with a disability in the United States with a correlation coefficient (R) of 0.404 and weighted average of 11.8%. Similarly, the statistical analysis conducted on geographies consisting of 528,469,982 people shows a poor positive correlation between the proportion of Welsh and percentage of males with a disability in the United States with a correlation coefficient (R) of 0.154 and weighted average of 12.7%, a difference of 8.4%.
Male Disability Correlation Summary
| Measurement | Subsaharan African | Welsh |
| Minimum | 3.6% | 1.4% |
| Maximum | 38.5% | 100.0% |
| Range | 34.8% | 98.6% |
| Mean | 13.8% | 20.6% |
| Median | 11.7% | 16.6% |
| Interquartile 25% (IQ1) | 11.0% | 13.5% |
| Interquartile 75% (IQ3) | 13.7% | 20.7% |
| Interquartile Range (IQR) | 2.8% | 7.1% |
| Standard Deviation (Sample) | 6.1% | 15.0% |
| Standard Deviation (Population) | 6.0% | 14.8% |
Similar Demographics by Male Disability
Demographics Similar to Sub-Saharan Africans by Male Disability
In terms of male disability, the demographic groups most similar to Sub-Saharan Africans are Liberian (11.8%, a difference of 0.12%), Japanese (11.7%, a difference of 0.13%), Immigrants from Bahamas (11.7%, a difference of 0.15%), Austrian (11.8%, a difference of 0.18%), and Alsatian (11.7%, a difference of 0.24%).
| Demographics | Rating | Rank | Male Disability |
| Panamanians | 3.8 /100 | #219 | Tragic 11.7% |
| Immigrants | Western Europe | 3.8 /100 | #220 | Tragic 11.7% |
| Immigrants | Congo | 3.7 /100 | #221 | Tragic 11.7% |
| Alsatians | 3.3 /100 | #222 | Tragic 11.7% |
| Immigrants | Bahamas | 3.2 /100 | #223 | Tragic 11.7% |
| Japanese | 3.1 /100 | #224 | Tragic 11.7% |
| Liberians | 3.1 /100 | #225 | Tragic 11.8% |
| Sub-Saharan Africans | 2.8 /100 | #226 | Tragic 11.8% |
| Austrians | 2.5 /100 | #227 | Tragic 11.8% |
| Hispanics or Latinos | 2.3 /100 | #228 | Tragic 11.8% |
| Bermudans | 2.3 /100 | #229 | Tragic 11.8% |
| Croatians | 2.1 /100 | #230 | Tragic 11.8% |
| Dominicans | 1.8 /100 | #231 | Tragic 11.8% |
| Malaysians | 1.8 /100 | #232 | Tragic 11.8% |
| Mexicans | 1.7 /100 | #233 | Tragic 11.8% |
Demographics Similar to Welsh by Male Disability
In terms of male disability, the demographic groups most similar to Welsh are Spanish (12.7%, a difference of 0.0%), Scottish (12.8%, a difference of 0.050%), Cape Verdean (12.8%, a difference of 0.12%), German (12.7%, a difference of 0.27%), and Irish (12.7%, a difference of 0.28%).
| Demographics | Rating | Rank | Male Disability |
| Central American Indians | 0.0 /100 | #278 | Tragic 12.7% |
| Slovaks | 0.0 /100 | #279 | Tragic 12.7% |
| Dutch | 0.0 /100 | #280 | Tragic 12.7% |
| Sioux | 0.0 /100 | #281 | Tragic 12.7% |
| Irish | 0.0 /100 | #282 | Tragic 12.7% |
| Germans | 0.0 /100 | #283 | Tragic 12.7% |
| Spanish | 0.0 /100 | #284 | Tragic 12.7% |
| Welsh | 0.0 /100 | #285 | Tragic 12.7% |
| Scottish | 0.0 /100 | #286 | Tragic 12.8% |
| Cape Verdeans | 0.0 /100 | #287 | Tragic 12.8% |
| Yup'ik | 0.0 /100 | #288 | Tragic 12.8% |
| Immigrants | Cabo Verde | 0.0 /100 | #289 | Tragic 12.8% |
| Pima | 0.0 /100 | #290 | Tragic 12.8% |
| Whites/Caucasians | 0.0 /100 | #291 | Tragic 12.8% |
| English | 0.0 /100 | #292 | Tragic 12.8% |