Immigrants from Trinidad and Tobago vs Immigrants from South Africa Male Disability
COMPARE
Immigrants from Trinidad and Tobago
Immigrants from South Africa
Male Disability
Male Disability Comparison
Immigrants from Trinidad and Tobago
Immigrants from South Africa
10.9%
MALE DISABILITY
86.9/ 100
METRIC RATING
126th/ 347
METRIC RANK
10.8%
MALE DISABILITY
91.8/ 100
METRIC RATING
116th/ 347
METRIC RANK
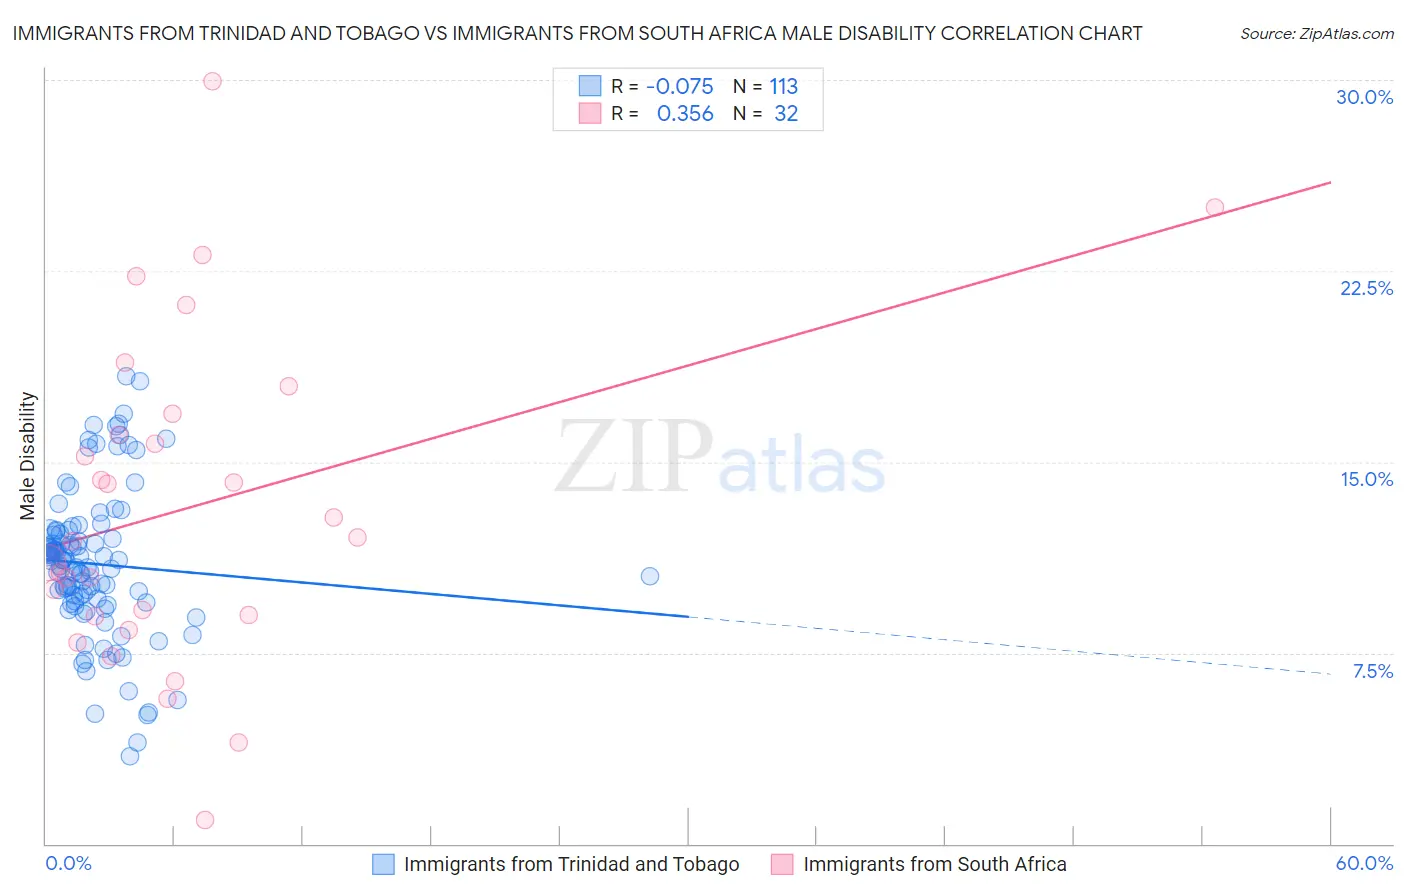
Immigrants from Trinidad and Tobago vs Immigrants from South Africa Male Disability Correlation Chart
The statistical analysis conducted on geographies consisting of 223,502,248 people shows a slight negative correlation between the proportion of Immigrants from Trinidad and Tobago and percentage of males with a disability in the United States with a correlation coefficient (R) of -0.075 and weighted average of 10.9%. Similarly, the statistical analysis conducted on geographies consisting of 233,300,500 people shows a mild positive correlation between the proportion of Immigrants from South Africa and percentage of males with a disability in the United States with a correlation coefficient (R) of 0.356 and weighted average of 10.8%, a difference of 0.75%.
Male Disability Correlation Summary
| Measurement | Immigrants from Trinidad and Tobago | Immigrants from South Africa |
| Minimum | 3.4% | 0.92% |
| Maximum | 18.4% | 30.0% |
| Range | 14.9% | 29.0% |
| Mean | 11.0% | 13.2% |
| Median | 11.1% | 12.0% |
| Interquartile 25% (IQ1) | 9.5% | 8.9% |
| Interquartile 75% (IQ3) | 12.2% | 16.5% |
| Interquartile Range (IQR) | 2.7% | 7.5% |
| Standard Deviation (Sample) | 2.9% | 6.4% |
| Standard Deviation (Population) | 2.9% | 6.3% |
Demographics Similar to Immigrants from Trinidad and Tobago and Immigrants from South Africa by Male Disability
In terms of male disability, the demographic groups most similar to Immigrants from Trinidad and Tobago are Immigrants from Ukraine (10.9%, a difference of 0.010%), South American Indian (10.9%, a difference of 0.16%), Immigrants from North Macedonia (10.9%, a difference of 0.16%), Immigrants from Latvia (10.9%, a difference of 0.17%), and Immigrants from Philippines (10.9%, a difference of 0.17%). Similarly, the demographic groups most similar to Immigrants from South Africa are Immigrants from Barbados (10.8%, a difference of 0.080%), Central American (10.8%, a difference of 0.17%), Eastern European (10.9%, a difference of 0.21%), Immigrants from Zimbabwe (10.8%, a difference of 0.24%), and Immigrants from Cuba (10.9%, a difference of 0.29%).
| Demographics | Rating | Rank | Male Disability |
| Immigrants | Uruguay | 93.8 /100 | #111 | Exceptional 10.8% |
| Ghanaians | 93.4 /100 | #112 | Exceptional 10.8% |
| Immigrants | Zimbabwe | 93.0 /100 | #113 | Exceptional 10.8% |
| Central Americans | 92.7 /100 | #114 | Exceptional 10.8% |
| Immigrants | Barbados | 92.2 /100 | #115 | Exceptional 10.8% |
| Immigrants | South Africa | 91.8 /100 | #116 | Exceptional 10.8% |
| Eastern Europeans | 90.6 /100 | #117 | Exceptional 10.9% |
| Immigrants | Cuba | 90.2 /100 | #118 | Exceptional 10.9% |
| Armenians | 90.1 /100 | #119 | Exceptional 10.9% |
| Immigrants | Africa | 89.4 /100 | #120 | Excellent 10.9% |
| Immigrants | South Eastern Asia | 89.2 /100 | #121 | Excellent 10.9% |
| Immigrants | Ghana | 89.0 /100 | #122 | Excellent 10.9% |
| Immigrants | Czechoslovakia | 88.4 /100 | #123 | Excellent 10.9% |
| South American Indians | 88.1 /100 | #124 | Excellent 10.9% |
| Immigrants | North Macedonia | 88.1 /100 | #125 | Excellent 10.9% |
| Immigrants | Trinidad and Tobago | 86.9 /100 | #126 | Excellent 10.9% |
| Immigrants | Ukraine | 86.8 /100 | #127 | Excellent 10.9% |
| Immigrants | Latvia | 85.5 /100 | #128 | Excellent 10.9% |
| Immigrants | Philippines | 85.4 /100 | #129 | Excellent 10.9% |
| Brazilians | 85.4 /100 | #130 | Excellent 10.9% |
| Macedonians | 84.2 /100 | #131 | Excellent 11.0% |