Immigrants from Australia vs Welsh Male Disability
COMPARE
Immigrants from Australia
Welsh
Male Disability
Male Disability Comparison
Immigrants from Australia
Welsh
10.4%
MALE DISABILITY
99.5/ 100
METRIC RATING
59th/ 347
METRIC RANK
12.7%
MALE DISABILITY
0.0/ 100
METRIC RATING
285th/ 347
METRIC RANK
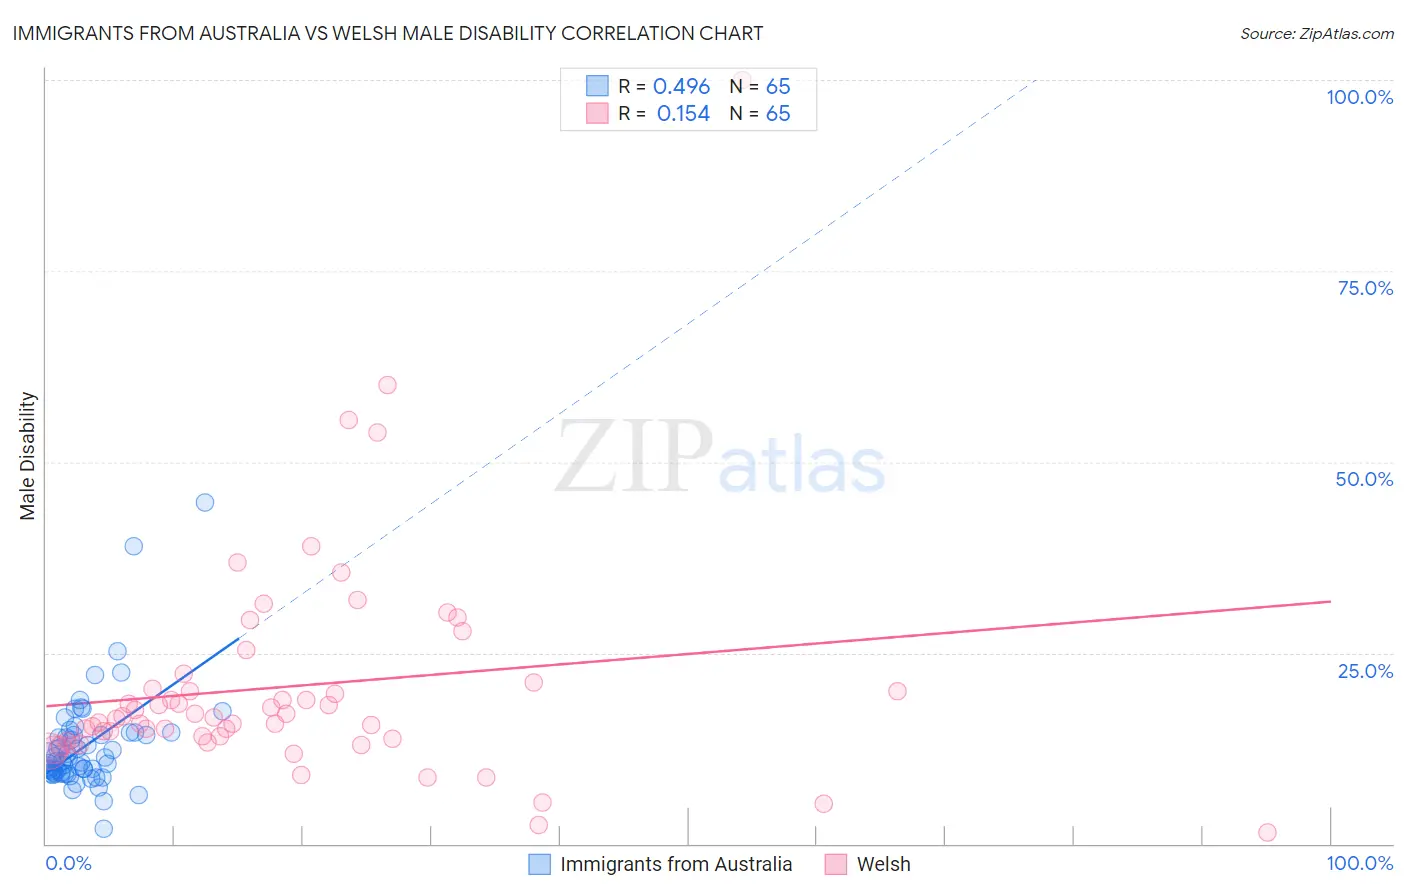
Immigrants from Australia vs Welsh Male Disability Correlation Chart
The statistical analysis conducted on geographies consisting of 227,204,405 people shows a moderate positive correlation between the proportion of Immigrants from Australia and percentage of males with a disability in the United States with a correlation coefficient (R) of 0.496 and weighted average of 10.4%. Similarly, the statistical analysis conducted on geographies consisting of 528,469,982 people shows a poor positive correlation between the proportion of Welsh and percentage of males with a disability in the United States with a correlation coefficient (R) of 0.154 and weighted average of 12.7%, a difference of 22.6%.
Male Disability Correlation Summary
| Measurement | Immigrants from Australia | Welsh |
| Minimum | 2.0% | 1.4% |
| Maximum | 44.7% | 100.0% |
| Range | 42.7% | 98.6% |
| Mean | 12.8% | 20.6% |
| Median | 10.9% | 16.6% |
| Interquartile 25% (IQ1) | 9.2% | 13.5% |
| Interquartile 75% (IQ3) | 14.4% | 20.7% |
| Interquartile Range (IQR) | 5.2% | 7.1% |
| Standard Deviation (Sample) | 6.6% | 15.0% |
| Standard Deviation (Population) | 6.6% | 14.8% |
Similar Demographics by Male Disability
Demographics Similar to Immigrants from Australia by Male Disability
In terms of male disability, the demographic groups most similar to Immigrants from Australia are Immigrants from Colombia (10.4%, a difference of 0.060%), Immigrants from Japan (10.4%, a difference of 0.14%), Immigrants from Northern Africa (10.4%, a difference of 0.15%), Immigrants from South America (10.4%, a difference of 0.22%), and Tongan (10.4%, a difference of 0.24%).
| Demographics | Rating | Rank | Male Disability |
| Immigrants | Saudi Arabia | 99.6 /100 | #52 | Exceptional 10.4% |
| Immigrants | Uzbekistan | 99.6 /100 | #53 | Exceptional 10.4% |
| Peruvians | 99.6 /100 | #54 | Exceptional 10.4% |
| Immigrants | Eritrea | 99.6 /100 | #55 | Exceptional 10.4% |
| Tongans | 99.6 /100 | #56 | Exceptional 10.4% |
| Immigrants | South America | 99.6 /100 | #57 | Exceptional 10.4% |
| Immigrants | Japan | 99.5 /100 | #58 | Exceptional 10.4% |
| Immigrants | Australia | 99.5 /100 | #59 | Exceptional 10.4% |
| Immigrants | Colombia | 99.5 /100 | #60 | Exceptional 10.4% |
| Immigrants | Northern Africa | 99.4 /100 | #61 | Exceptional 10.4% |
| Immigrants | Ecuador | 99.3 /100 | #62 | Exceptional 10.4% |
| Immigrants | Belarus | 99.3 /100 | #63 | Exceptional 10.4% |
| Jordanians | 99.3 /100 | #64 | Exceptional 10.5% |
| Immigrants | Grenada | 99.2 /100 | #65 | Exceptional 10.5% |
| Guyanese | 99.2 /100 | #66 | Exceptional 10.5% |
Demographics Similar to Welsh by Male Disability
In terms of male disability, the demographic groups most similar to Welsh are Spanish (12.7%, a difference of 0.0%), Scottish (12.8%, a difference of 0.050%), Cape Verdean (12.8%, a difference of 0.12%), German (12.7%, a difference of 0.27%), and Irish (12.7%, a difference of 0.28%).
| Demographics | Rating | Rank | Male Disability |
| Central American Indians | 0.0 /100 | #278 | Tragic 12.7% |
| Slovaks | 0.0 /100 | #279 | Tragic 12.7% |
| Dutch | 0.0 /100 | #280 | Tragic 12.7% |
| Sioux | 0.0 /100 | #281 | Tragic 12.7% |
| Irish | 0.0 /100 | #282 | Tragic 12.7% |
| Germans | 0.0 /100 | #283 | Tragic 12.7% |
| Spanish | 0.0 /100 | #284 | Tragic 12.7% |
| Welsh | 0.0 /100 | #285 | Tragic 12.7% |
| Scottish | 0.0 /100 | #286 | Tragic 12.8% |
| Cape Verdeans | 0.0 /100 | #287 | Tragic 12.8% |
| Yup'ik | 0.0 /100 | #288 | Tragic 12.8% |
| Immigrants | Cabo Verde | 0.0 /100 | #289 | Tragic 12.8% |
| Pima | 0.0 /100 | #290 | Tragic 12.8% |
| Whites/Caucasians | 0.0 /100 | #291 | Tragic 12.8% |
| English | 0.0 /100 | #292 | Tragic 12.8% |