Immigrants from Mexico vs Welsh Male Disability
COMPARE
Immigrants from Mexico
Welsh
Male Disability
Male Disability Comparison
Immigrants from Mexico
Welsh
11.5%
MALE DISABILITY
12.6/ 100
METRIC RATING
202nd/ 347
METRIC RANK
12.7%
MALE DISABILITY
0.0/ 100
METRIC RATING
285th/ 347
METRIC RANK
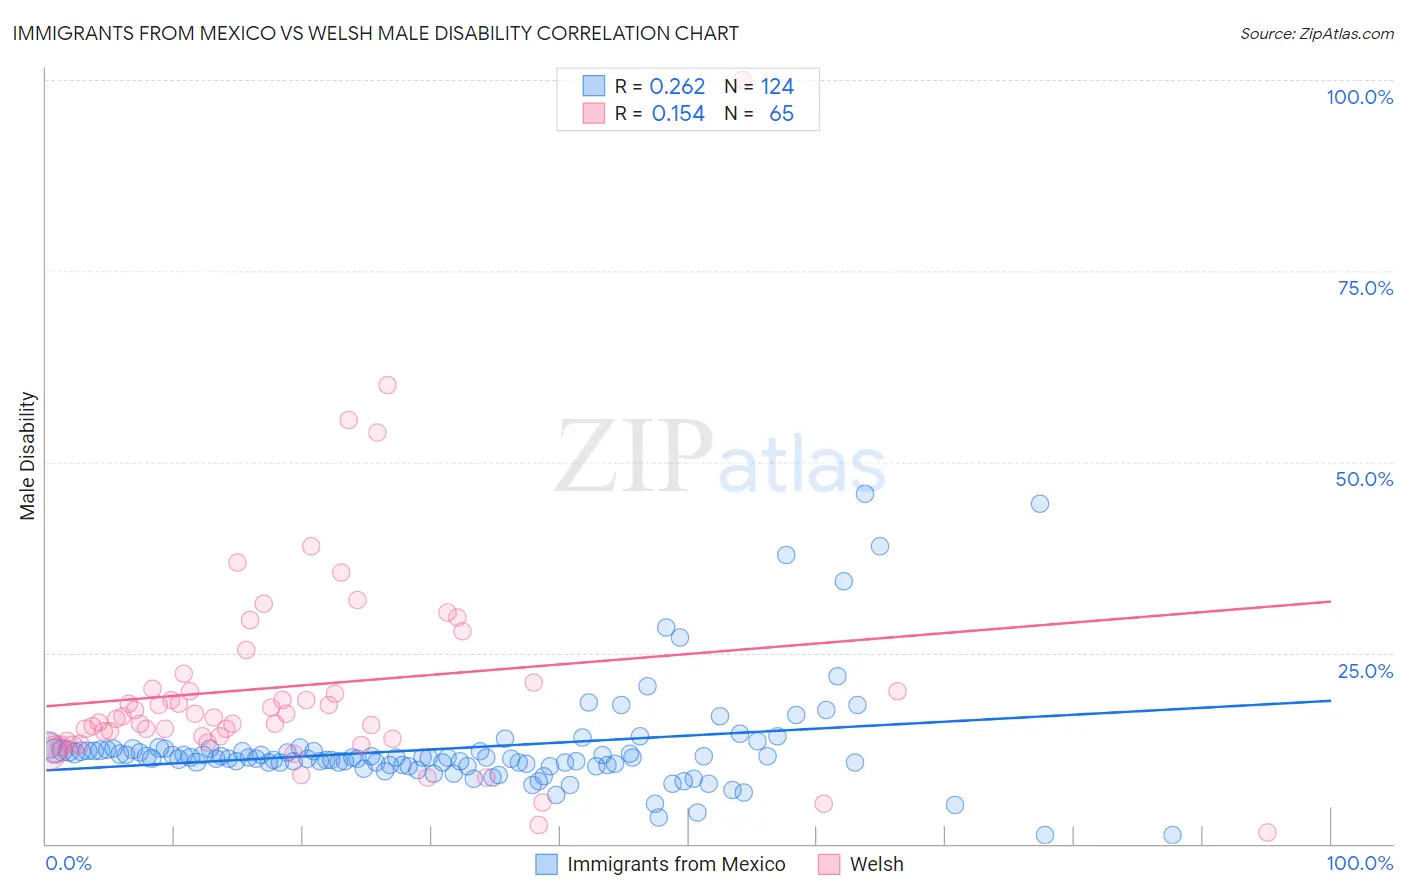
Immigrants from Mexico vs Welsh Male Disability Correlation Chart
The statistical analysis conducted on geographies consisting of 513,525,240 people shows a weak positive correlation between the proportion of Immigrants from Mexico and percentage of males with a disability in the United States with a correlation coefficient (R) of 0.262 and weighted average of 11.5%. Similarly, the statistical analysis conducted on geographies consisting of 528,469,982 people shows a poor positive correlation between the proportion of Welsh and percentage of males with a disability in the United States with a correlation coefficient (R) of 0.154 and weighted average of 12.7%, a difference of 10.7%.
Male Disability Correlation Summary
| Measurement | Immigrants from Mexico | Welsh |
| Minimum | 1.2% | 1.4% |
| Maximum | 45.8% | 100.0% |
| Range | 44.6% | 98.6% |
| Mean | 12.5% | 20.6% |
| Median | 11.2% | 16.6% |
| Interquartile 25% (IQ1) | 10.3% | 13.5% |
| Interquartile 75% (IQ3) | 12.2% | 20.7% |
| Interquartile Range (IQR) | 1.9% | 7.1% |
| Standard Deviation (Sample) | 6.8% | 15.0% |
| Standard Deviation (Population) | 6.8% | 14.8% |
Similar Demographics by Male Disability
Demographics Similar to Immigrants from Mexico by Male Disability
In terms of male disability, the demographic groups most similar to Immigrants from Mexico are Immigrants from Iraq (11.5%, a difference of 0.040%), Immigrants from Panama (11.5%, a difference of 0.040%), Jamaican (11.5%, a difference of 0.23%), Immigrants from Cambodia (11.5%, a difference of 0.25%), and Serbian (11.5%, a difference of 0.25%).
| Demographics | Rating | Rank | Male Disability |
| Immigrants | Oceania | 20.9 /100 | #195 | Fair 11.4% |
| West Indians | 18.4 /100 | #196 | Poor 11.4% |
| Somalis | 18.2 /100 | #197 | Poor 11.4% |
| Immigrants | Jamaica | 16.3 /100 | #198 | Poor 11.5% |
| Lebanese | 15.4 /100 | #199 | Poor 11.5% |
| Immigrants | Iraq | 13.0 /100 | #200 | Poor 11.5% |
| Immigrants | Panama | 13.0 /100 | #201 | Poor 11.5% |
| Immigrants | Mexico | 12.6 /100 | #202 | Poor 11.5% |
| Jamaicans | 10.9 /100 | #203 | Poor 11.5% |
| Immigrants | Cambodia | 10.8 /100 | #204 | Poor 11.5% |
| Serbians | 10.7 /100 | #205 | Poor 11.5% |
| Ukrainians | 10.6 /100 | #206 | Poor 11.5% |
| Immigrants | Somalia | 10.4 /100 | #207 | Poor 11.5% |
| Icelanders | 10.1 /100 | #208 | Poor 11.6% |
| Spanish American Indians | 10.1 /100 | #209 | Poor 11.6% |
Demographics Similar to Welsh by Male Disability
In terms of male disability, the demographic groups most similar to Welsh are Spanish (12.7%, a difference of 0.0%), Scottish (12.8%, a difference of 0.050%), Cape Verdean (12.8%, a difference of 0.12%), German (12.7%, a difference of 0.27%), and Irish (12.7%, a difference of 0.28%).
| Demographics | Rating | Rank | Male Disability |
| Central American Indians | 0.0 /100 | #278 | Tragic 12.7% |
| Slovaks | 0.0 /100 | #279 | Tragic 12.7% |
| Dutch | 0.0 /100 | #280 | Tragic 12.7% |
| Sioux | 0.0 /100 | #281 | Tragic 12.7% |
| Irish | 0.0 /100 | #282 | Tragic 12.7% |
| Germans | 0.0 /100 | #283 | Tragic 12.7% |
| Spanish | 0.0 /100 | #284 | Tragic 12.7% |
| Welsh | 0.0 /100 | #285 | Tragic 12.7% |
| Scottish | 0.0 /100 | #286 | Tragic 12.8% |
| Cape Verdeans | 0.0 /100 | #287 | Tragic 12.8% |
| Yup'ik | 0.0 /100 | #288 | Tragic 12.8% |
| Immigrants | Cabo Verde | 0.0 /100 | #289 | Tragic 12.8% |
| Pima | 0.0 /100 | #290 | Tragic 12.8% |
| Whites/Caucasians | 0.0 /100 | #291 | Tragic 12.8% |
| English | 0.0 /100 | #292 | Tragic 12.8% |