Immigrants from Taiwan vs Inupiat Disability Age Under 5
COMPARE
Immigrants from Taiwan
Inupiat
Disability Age Under 5
Disability Age Under 5 Comparison
Immigrants from Taiwan
Inupiat
1.0%
DISABILITY AGE UNDER 5
100.0/ 100
METRIC RATING
26th/ 347
METRIC RANK
3.7%
DISABILITY AGE UNDER 5
0.0/ 100
METRIC RATING
344th/ 347
METRIC RANK
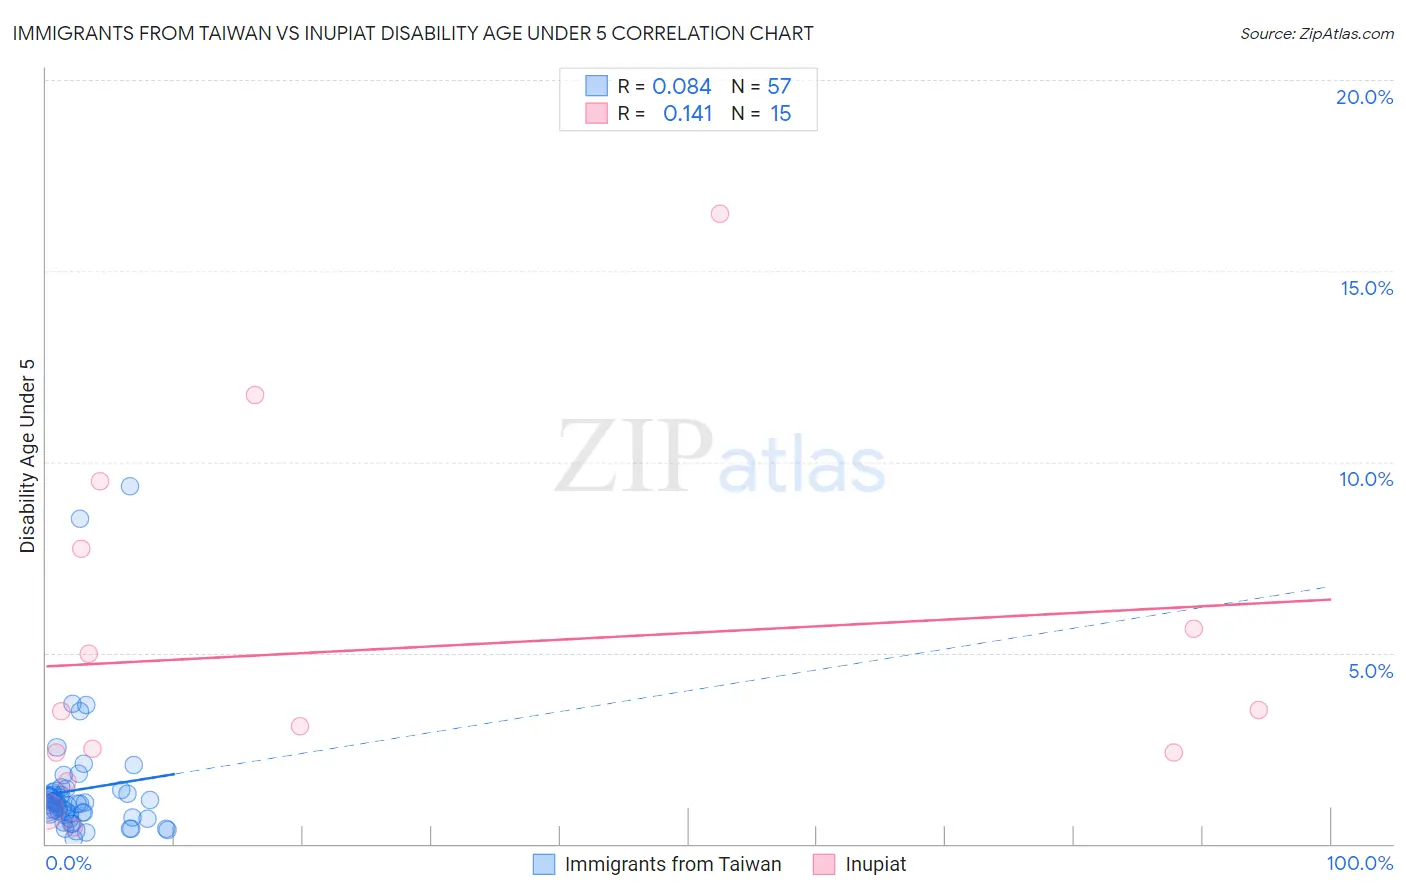
Immigrants from Taiwan vs Inupiat Disability Age Under 5 Correlation Chart
The statistical analysis conducted on geographies consisting of 173,979,803 people shows a slight positive correlation between the proportion of Immigrants from Taiwan and percentage of population with a disability under the age of 5 in the United States with a correlation coefficient (R) of 0.084 and weighted average of 1.0%. Similarly, the statistical analysis conducted on geographies consisting of 76,997,061 people shows a poor positive correlation between the proportion of Inupiat and percentage of population with a disability under the age of 5 in the United States with a correlation coefficient (R) of 0.141 and weighted average of 3.7%, a difference of 268.7%.
Disability Age Under 5 Correlation Summary
| Measurement | Immigrants from Taiwan | Inupiat |
| Minimum | 0.13% | 0.42% |
| Maximum | 9.4% | 16.5% |
| Range | 9.2% | 16.1% |
| Mean | 1.4% | 5.1% |
| Median | 1.1% | 3.5% |
| Interquartile 25% (IQ1) | 0.73% | 2.4% |
| Interquartile 75% (IQ3) | 1.4% | 7.7% |
| Interquartile Range (IQR) | 0.63% | 5.4% |
| Standard Deviation (Sample) | 1.6% | 4.5% |
| Standard Deviation (Population) | 1.6% | 4.4% |
Similar Demographics by Disability Age Under 5
Demographics Similar to Immigrants from Taiwan by Disability Age Under 5
In terms of disability age under 5, the demographic groups most similar to Immigrants from Taiwan are Immigrants from Micronesia (1.0%, a difference of 0.12%), Indian (Asian) (1.0%, a difference of 0.43%), Yakama (1.00%, a difference of 0.72%), Immigrants from Iran (1.00%, a difference of 0.79%), and Guyanese (1.0%, a difference of 0.84%).
| Demographics | Rating | Rank | Disability Age Under 5 |
| Puget Sound Salish | 100.0 /100 | #19 | Exceptional 0.97% |
| Nepalese | 100.0 /100 | #20 | Exceptional 0.97% |
| British West Indians | 100.0 /100 | #21 | Exceptional 0.99% |
| Immigrants | Iran | 100.0 /100 | #22 | Exceptional 1.00% |
| Yakama | 100.0 /100 | #23 | Exceptional 1.00% |
| Indians (Asian) | 100.0 /100 | #24 | Exceptional 1.0% |
| Immigrants | Micronesia | 100.0 /100 | #25 | Exceptional 1.0% |
| Immigrants | Taiwan | 100.0 /100 | #26 | Exceptional 1.0% |
| Guyanese | 100.0 /100 | #27 | Exceptional 1.0% |
| Immigrants | Eastern Asia | 100.0 /100 | #28 | Exceptional 1.0% |
| Immigrants | Belarus | 100.0 /100 | #29 | Exceptional 1.0% |
| Immigrants | South Central Asia | 99.9 /100 | #30 | Exceptional 1.0% |
| Armenians | 99.9 /100 | #31 | Exceptional 1.0% |
| Iranians | 99.9 /100 | #32 | Exceptional 1.0% |
| Bolivians | 99.9 /100 | #33 | Exceptional 1.0% |
Demographics Similar to Inupiat by Disability Age Under 5
In terms of disability age under 5, the demographic groups most similar to Inupiat are Paiute (3.9%, a difference of 5.3%), Colville (3.3%, a difference of 13.0%), Yup'ik (4.5%, a difference of 22.0%), Hopi (4.6%, a difference of 24.8%), and Alaska Native (2.9%, a difference of 26.1%).
| Demographics | Rating | Rank | Disability Age Under 5 |
| Dutch West Indians | 0.0 /100 | #333 | Tragic 1.9% |
| Natives/Alaskans | 0.0 /100 | #334 | Tragic 1.9% |
| Pennsylvania Germans | 0.0 /100 | #335 | Tragic 1.9% |
| Paraguayans | 0.0 /100 | #336 | Tragic 2.0% |
| Apache | 0.0 /100 | #337 | Tragic 2.0% |
| Tohono O'odham | 0.0 /100 | #338 | Tragic 2.2% |
| Immigrants | Azores | 0.0 /100 | #339 | Tragic 2.2% |
| Menominee | 0.0 /100 | #340 | Tragic 2.3% |
| Tsimshian | 0.0 /100 | #341 | Tragic 2.4% |
| Alaska Natives | 0.0 /100 | #342 | Tragic 2.9% |
| Colville | 0.0 /100 | #343 | Tragic 3.3% |
| Inupiat | 0.0 /100 | #344 | Tragic 3.7% |
| Paiute | 0.0 /100 | #345 | Tragic 3.9% |
| Yup'ik | 0.0 /100 | #346 | Tragic 4.5% |
| Hopi | 0.0 /100 | #347 | Tragic 4.6% |