Immigrants from Taiwan vs Immigrants from Switzerland Disability Age Under 5
COMPARE
Immigrants from Taiwan
Immigrants from Switzerland
Disability Age Under 5
Disability Age Under 5 Comparison
Immigrants from Taiwan
Immigrants from Switzerland
1.0%
DISABILITY AGE UNDER 5
100.0/ 100
METRIC RATING
26th/ 347
METRIC RANK
1.1%
DISABILITY AGE UNDER 5
99.2/ 100
METRIC RATING
62nd/ 347
METRIC RANK
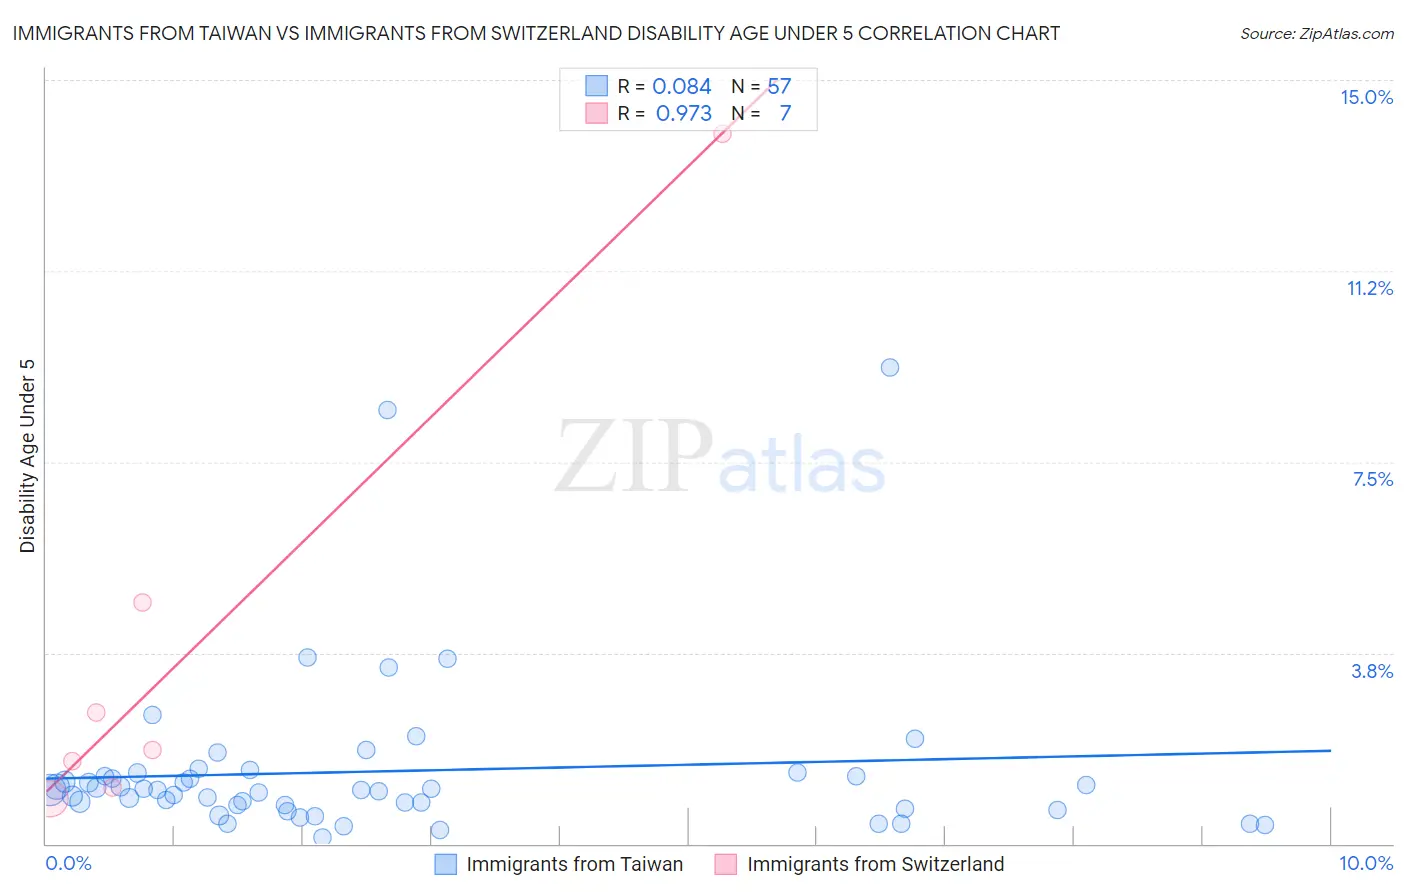
Immigrants from Taiwan vs Immigrants from Switzerland Disability Age Under 5 Correlation Chart
The statistical analysis conducted on geographies consisting of 173,979,803 people shows a slight positive correlation between the proportion of Immigrants from Taiwan and percentage of population with a disability under the age of 5 in the United States with a correlation coefficient (R) of 0.084 and weighted average of 1.0%. Similarly, the statistical analysis conducted on geographies consisting of 99,521,676 people shows a perfect positive correlation between the proportion of Immigrants from Switzerland and percentage of population with a disability under the age of 5 in the United States with a correlation coefficient (R) of 0.973 and weighted average of 1.1%, a difference of 9.9%.
Disability Age Under 5 Correlation Summary
| Measurement | Immigrants from Taiwan | Immigrants from Switzerland |
| Minimum | 0.13% | 0.89% |
| Maximum | 9.4% | 14.0% |
| Range | 9.2% | 13.1% |
| Mean | 1.4% | 3.8% |
| Median | 1.1% | 1.8% |
| Interquartile 25% (IQ1) | 0.73% | 1.1% |
| Interquartile 75% (IQ3) | 1.4% | 4.7% |
| Interquartile Range (IQR) | 0.63% | 3.6% |
| Standard Deviation (Sample) | 1.6% | 4.6% |
| Standard Deviation (Population) | 1.6% | 4.3% |
Similar Demographics by Disability Age Under 5
Demographics Similar to Immigrants from Taiwan by Disability Age Under 5
In terms of disability age under 5, the demographic groups most similar to Immigrants from Taiwan are Immigrants from Micronesia (1.0%, a difference of 0.12%), Indian (Asian) (1.0%, a difference of 0.43%), Yakama (1.00%, a difference of 0.72%), Immigrants from Iran (1.00%, a difference of 0.79%), and Guyanese (1.0%, a difference of 0.84%).
| Demographics | Rating | Rank | Disability Age Under 5 |
| Puget Sound Salish | 100.0 /100 | #19 | Exceptional 0.97% |
| Nepalese | 100.0 /100 | #20 | Exceptional 0.97% |
| British West Indians | 100.0 /100 | #21 | Exceptional 0.99% |
| Immigrants | Iran | 100.0 /100 | #22 | Exceptional 1.00% |
| Yakama | 100.0 /100 | #23 | Exceptional 1.00% |
| Indians (Asian) | 100.0 /100 | #24 | Exceptional 1.0% |
| Immigrants | Micronesia | 100.0 /100 | #25 | Exceptional 1.0% |
| Immigrants | Taiwan | 100.0 /100 | #26 | Exceptional 1.0% |
| Guyanese | 100.0 /100 | #27 | Exceptional 1.0% |
| Immigrants | Eastern Asia | 100.0 /100 | #28 | Exceptional 1.0% |
| Immigrants | Belarus | 100.0 /100 | #29 | Exceptional 1.0% |
| Immigrants | South Central Asia | 99.9 /100 | #30 | Exceptional 1.0% |
| Armenians | 99.9 /100 | #31 | Exceptional 1.0% |
| Iranians | 99.9 /100 | #32 | Exceptional 1.0% |
| Bolivians | 99.9 /100 | #33 | Exceptional 1.0% |
Demographics Similar to Immigrants from Switzerland by Disability Age Under 5
In terms of disability age under 5, the demographic groups most similar to Immigrants from Switzerland are Immigrants from Ethiopia (1.1%, a difference of 0.010%), Immigrants from Western Asia (1.1%, a difference of 0.070%), Immigrants from Vietnam (1.1%, a difference of 0.11%), Egyptian (1.1%, a difference of 0.57%), and Immigrants from Malaysia (1.1%, a difference of 0.83%).
| Demographics | Rating | Rank | Disability Age Under 5 |
| Salvadorans | 99.5 /100 | #55 | Exceptional 1.1% |
| Ecuadorians | 99.5 /100 | #56 | Exceptional 1.1% |
| Assyrians/Chaldeans/Syriacs | 99.5 /100 | #57 | Exceptional 1.1% |
| Immigrants | Egypt | 99.4 /100 | #58 | Exceptional 1.1% |
| Immigrants | Malaysia | 99.4 /100 | #59 | Exceptional 1.1% |
| Immigrants | Western Asia | 99.2 /100 | #60 | Exceptional 1.1% |
| Immigrants | Ethiopia | 99.2 /100 | #61 | Exceptional 1.1% |
| Immigrants | Switzerland | 99.2 /100 | #62 | Exceptional 1.1% |
| Immigrants | Vietnam | 99.1 /100 | #63 | Exceptional 1.1% |
| Egyptians | 98.9 /100 | #64 | Exceptional 1.1% |
| Immigrants | Korea | 98.8 /100 | #65 | Exceptional 1.1% |
| Immigrants | Indonesia | 98.7 /100 | #66 | Exceptional 1.1% |
| Immigrants | Belize | 98.7 /100 | #67 | Exceptional 1.1% |
| South Africans | 98.7 /100 | #68 | Exceptional 1.1% |
| Israelis | 98.7 /100 | #69 | Exceptional 1.1% |