Immigrants from Taiwan vs Immigrants from Zaire Disability Age Under 5
COMPARE
Immigrants from Taiwan
Immigrants from Zaire
Disability Age Under 5
Disability Age Under 5 Comparison
Immigrants from Taiwan
Immigrants from Zaire
1.0%
DISABILITY AGE UNDER 5
100.0/ 100
METRIC RATING
26th/ 347
METRIC RANK
1.1%
DISABILITY AGE UNDER 5
97.8/ 100
METRIC RATING
84th/ 347
METRIC RANK
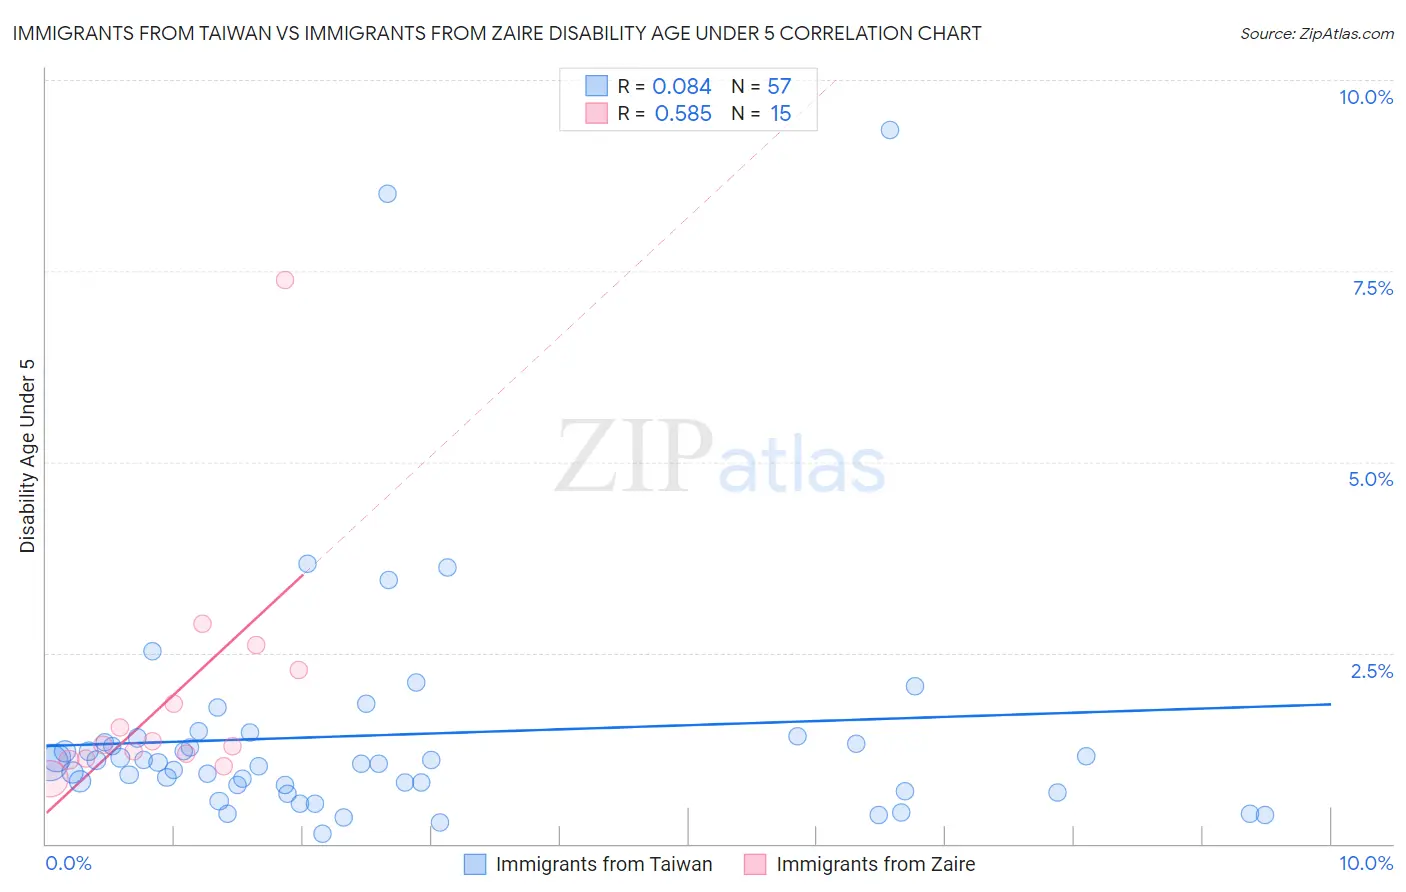
Immigrants from Taiwan vs Immigrants from Zaire Disability Age Under 5 Correlation Chart
The statistical analysis conducted on geographies consisting of 173,979,803 people shows a slight positive correlation between the proportion of Immigrants from Taiwan and percentage of population with a disability under the age of 5 in the United States with a correlation coefficient (R) of 0.084 and weighted average of 1.0%. Similarly, the statistical analysis conducted on geographies consisting of 82,804,930 people shows a substantial positive correlation between the proportion of Immigrants from Zaire and percentage of population with a disability under the age of 5 in the United States with a correlation coefficient (R) of 0.585 and weighted average of 1.1%, a difference of 12.7%.
Disability Age Under 5 Correlation Summary
| Measurement | Immigrants from Taiwan | Immigrants from Zaire |
| Minimum | 0.13% | 0.85% |
| Maximum | 9.4% | 7.4% |
| Range | 9.2% | 6.5% |
| Mean | 1.4% | 1.9% |
| Median | 1.1% | 1.3% |
| Interquartile 25% (IQ1) | 0.73% | 1.1% |
| Interquartile 75% (IQ3) | 1.4% | 2.3% |
| Interquartile Range (IQR) | 0.63% | 1.2% |
| Standard Deviation (Sample) | 1.6% | 1.6% |
| Standard Deviation (Population) | 1.6% | 1.6% |
Similar Demographics by Disability Age Under 5
Demographics Similar to Immigrants from Taiwan by Disability Age Under 5
In terms of disability age under 5, the demographic groups most similar to Immigrants from Taiwan are Immigrants from Micronesia (1.0%, a difference of 0.12%), Indian (Asian) (1.0%, a difference of 0.43%), Yakama (1.00%, a difference of 0.72%), Immigrants from Iran (1.00%, a difference of 0.79%), and Guyanese (1.0%, a difference of 0.84%).
| Demographics | Rating | Rank | Disability Age Under 5 |
| Puget Sound Salish | 100.0 /100 | #19 | Exceptional 0.97% |
| Nepalese | 100.0 /100 | #20 | Exceptional 0.97% |
| British West Indians | 100.0 /100 | #21 | Exceptional 0.99% |
| Immigrants | Iran | 100.0 /100 | #22 | Exceptional 1.00% |
| Yakama | 100.0 /100 | #23 | Exceptional 1.00% |
| Indians (Asian) | 100.0 /100 | #24 | Exceptional 1.0% |
| Immigrants | Micronesia | 100.0 /100 | #25 | Exceptional 1.0% |
| Immigrants | Taiwan | 100.0 /100 | #26 | Exceptional 1.0% |
| Guyanese | 100.0 /100 | #27 | Exceptional 1.0% |
| Immigrants | Eastern Asia | 100.0 /100 | #28 | Exceptional 1.0% |
| Immigrants | Belarus | 100.0 /100 | #29 | Exceptional 1.0% |
| Immigrants | South Central Asia | 99.9 /100 | #30 | Exceptional 1.0% |
| Armenians | 99.9 /100 | #31 | Exceptional 1.0% |
| Iranians | 99.9 /100 | #32 | Exceptional 1.0% |
| Bolivians | 99.9 /100 | #33 | Exceptional 1.0% |
Demographics Similar to Immigrants from Zaire by Disability Age Under 5
In terms of disability age under 5, the demographic groups most similar to Immigrants from Zaire are Sudanese (1.1%, a difference of 0.080%), Immigrants from Syria (1.1%, a difference of 0.15%), Immigrants from Jordan (1.1%, a difference of 0.16%), Okinawan (1.1%, a difference of 0.20%), and Ugandan (1.1%, a difference of 0.22%).
| Demographics | Rating | Rank | Disability Age Under 5 |
| Immigrants | Denmark | 98.1 /100 | #77 | Exceptional 1.1% |
| West Indians | 98.0 /100 | #78 | Exceptional 1.1% |
| Hmong | 98.0 /100 | #79 | Exceptional 1.1% |
| Immigrants | Trinidad and Tobago | 98.0 /100 | #80 | Exceptional 1.1% |
| Turks | 98.0 /100 | #81 | Exceptional 1.1% |
| Immigrants | Jordan | 97.9 /100 | #82 | Exceptional 1.1% |
| Immigrants | Syria | 97.9 /100 | #83 | Exceptional 1.1% |
| Immigrants | Zaire | 97.8 /100 | #84 | Exceptional 1.1% |
| Sudanese | 97.7 /100 | #85 | Exceptional 1.1% |
| Okinawans | 97.6 /100 | #86 | Exceptional 1.1% |
| Ugandans | 97.5 /100 | #87 | Exceptional 1.1% |
| Immigrants | Dominican Republic | 97.5 /100 | #88 | Exceptional 1.1% |
| Ethiopians | 97.2 /100 | #89 | Exceptional 1.1% |
| Chinese | 97.2 /100 | #90 | Exceptional 1.1% |
| Albanians | 97.2 /100 | #91 | Exceptional 1.1% |