Immigrants from Taiwan vs Creek Disability Age 35 to 64
COMPARE
Immigrants from Taiwan
Creek
Disability Age 35 to 64
Disability Age 35 to 64 Comparison
Immigrants from Taiwan
Creek
7.8%
DISABILITY AGE 35 TO 64
100.0/ 100
METRIC RATING
1st/ 347
METRIC RANK
16.9%
DISABILITY AGE 35 TO 64
0.0/ 100
METRIC RATING
343rd/ 347
METRIC RANK
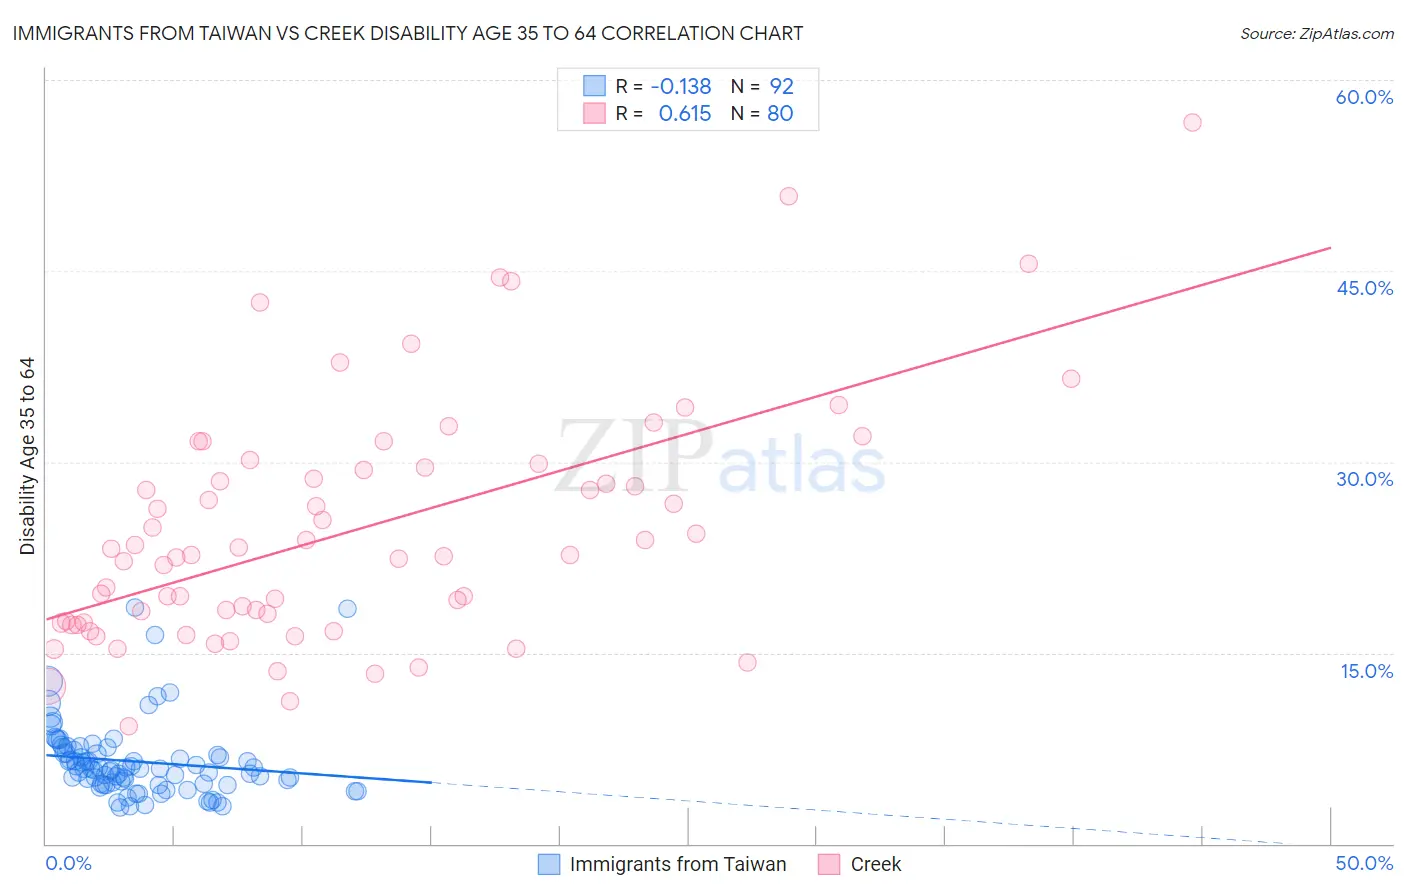
Immigrants from Taiwan vs Creek Disability Age 35 to 64 Correlation Chart
The statistical analysis conducted on geographies consisting of 298,104,424 people shows a poor negative correlation between the proportion of Immigrants from Taiwan and percentage of population with a disability between the ages 34 and 64 in the United States with a correlation coefficient (R) of -0.138 and weighted average of 7.8%. Similarly, the statistical analysis conducted on geographies consisting of 178,427,541 people shows a significant positive correlation between the proportion of Creek and percentage of population with a disability between the ages 34 and 64 in the United States with a correlation coefficient (R) of 0.615 and weighted average of 16.9%, a difference of 115.1%.
Disability Age 35 to 64 Correlation Summary
| Measurement | Immigrants from Taiwan | Creek |
| Minimum | 2.9% | 9.2% |
| Maximum | 18.6% | 56.7% |
| Range | 15.7% | 47.4% |
| Mean | 6.5% | 24.6% |
| Median | 5.9% | 22.7% |
| Interquartile 25% (IQ1) | 4.7% | 17.4% |
| Interquartile 75% (IQ3) | 7.2% | 29.5% |
| Interquartile Range (IQR) | 2.5% | 12.1% |
| Standard Deviation (Sample) | 2.9% | 9.4% |
| Standard Deviation (Population) | 2.9% | 9.3% |
Similar Demographics by Disability Age 35 to 64
Demographics Similar to Immigrants from Taiwan by Disability Age 35 to 64
In terms of disability age 35 to 64, the demographic groups most similar to Immigrants from Taiwan are Filipino (8.0%, a difference of 2.5%), Immigrants from Hong Kong (8.2%, a difference of 4.4%), Immigrants from India (8.3%, a difference of 5.5%), Immigrants from Iran (8.5%, a difference of 8.2%), and Thai (8.6%, a difference of 9.2%).
| Demographics | Rating | Rank | Disability Age 35 to 64 |
| Immigrants | Taiwan | 100.0 /100 | #1 | Exceptional 7.8% |
| Filipinos | 100.0 /100 | #2 | Exceptional 8.0% |
| Immigrants | Hong Kong | 100.0 /100 | #3 | Exceptional 8.2% |
| Immigrants | India | 100.0 /100 | #4 | Exceptional 8.3% |
| Immigrants | Iran | 100.0 /100 | #5 | Exceptional 8.5% |
| Thais | 100.0 /100 | #6 | Exceptional 8.6% |
| Immigrants | Israel | 100.0 /100 | #7 | Exceptional 8.6% |
| Iranians | 100.0 /100 | #8 | Exceptional 8.7% |
| Immigrants | China | 100.0 /100 | #9 | Exceptional 8.7% |
| Immigrants | Bolivia | 100.0 /100 | #10 | Exceptional 8.7% |
| Immigrants | Eastern Asia | 100.0 /100 | #11 | Exceptional 8.8% |
| Indians (Asian) | 100.0 /100 | #12 | Exceptional 8.9% |
| Immigrants | South Central Asia | 100.0 /100 | #13 | Exceptional 8.9% |
| Immigrants | Singapore | 100.0 /100 | #14 | Exceptional 8.9% |
| Bolivians | 100.0 /100 | #15 | Exceptional 8.9% |
Demographics Similar to Creek by Disability Age 35 to 64
In terms of disability age 35 to 64, the demographic groups most similar to Creek are Yup'ik (16.9%, a difference of 0.32%), Tohono O'odham (16.7%, a difference of 0.86%), Tsimshian (16.7%, a difference of 0.97%), Kiowa (17.4%, a difference of 2.8%), and Choctaw (16.4%, a difference of 2.9%).
| Demographics | Rating | Rank | Disability Age 35 to 64 |
| Yuman | 0.0 /100 | #333 | Tragic 15.8% |
| Colville | 0.0 /100 | #334 | Tragic 15.8% |
| Seminole | 0.0 /100 | #335 | Tragic 15.9% |
| Menominee | 0.0 /100 | #336 | Tragic 15.9% |
| Puerto Ricans | 0.0 /100 | #337 | Tragic 15.9% |
| Chickasaw | 0.0 /100 | #338 | Tragic 16.1% |
| Pima | 0.0 /100 | #339 | Tragic 16.1% |
| Choctaw | 0.0 /100 | #340 | Tragic 16.4% |
| Tsimshian | 0.0 /100 | #341 | Tragic 16.7% |
| Tohono O'odham | 0.0 /100 | #342 | Tragic 16.7% |
| Creek | 0.0 /100 | #343 | Tragic 16.9% |
| Yup'ik | 0.0 /100 | #344 | Tragic 16.9% |
| Kiowa | 0.0 /100 | #345 | Tragic 17.4% |
| Lumbee | 0.0 /100 | #346 | Tragic 17.6% |
| Houma | 0.0 /100 | #347 | Tragic 18.7% |