Immigrants from Taiwan vs Immigrants from Sri Lanka Vision Disability
COMPARE
Immigrants from Taiwan
Immigrants from Sri Lanka
Vision Disability
Vision Disability Comparison
Immigrants from Taiwan
Immigrants from Sri Lanka
1.7%
VISION DISABILITY
100.0/ 100
METRIC RATING
3rd/ 347
METRIC RANK
1.9%
VISION DISABILITY
100.0/ 100
METRIC RATING
19th/ 347
METRIC RANK
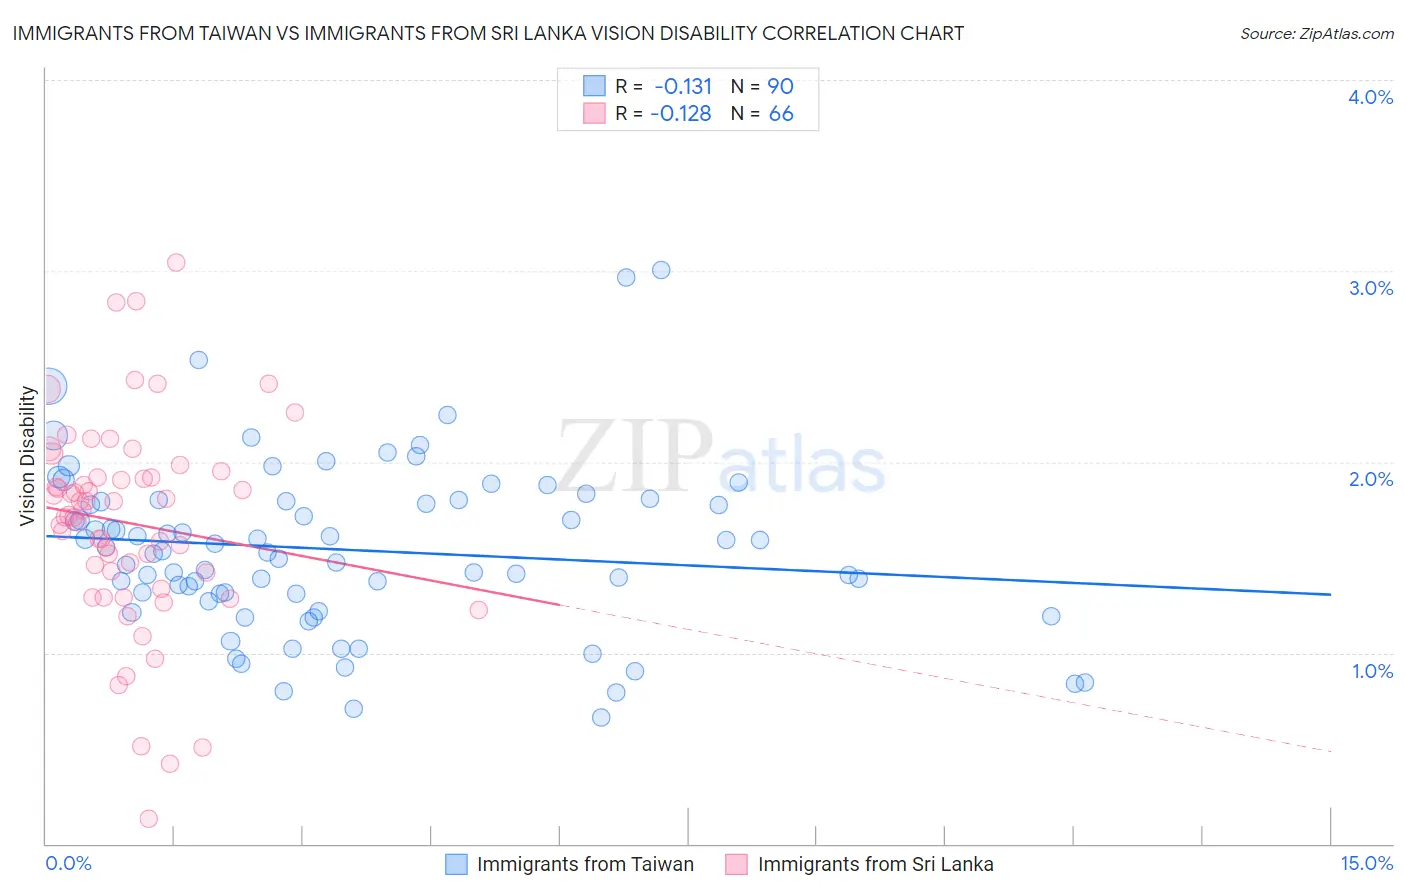
Immigrants from Taiwan vs Immigrants from Sri Lanka Vision Disability Correlation Chart
The statistical analysis conducted on geographies consisting of 298,112,915 people shows a poor negative correlation between the proportion of Immigrants from Taiwan and percentage of population with vision disability in the United States with a correlation coefficient (R) of -0.131 and weighted average of 1.7%. Similarly, the statistical analysis conducted on geographies consisting of 149,673,747 people shows a poor negative correlation between the proportion of Immigrants from Sri Lanka and percentage of population with vision disability in the United States with a correlation coefficient (R) of -0.128 and weighted average of 1.9%, a difference of 10.9%.
Vision Disability Correlation Summary
| Measurement | Immigrants from Taiwan | Immigrants from Sri Lanka |
| Minimum | 0.66% | 0.13% |
| Maximum | 3.0% | 3.0% |
| Range | 2.3% | 2.9% |
| Mean | 1.5% | 1.7% |
| Median | 1.5% | 1.7% |
| Interquartile 25% (IQ1) | 1.3% | 1.4% |
| Interquartile 75% (IQ3) | 1.8% | 1.9% |
| Interquartile Range (IQR) | 0.49% | 0.50% |
| Standard Deviation (Sample) | 0.44% | 0.55% |
| Standard Deviation (Population) | 0.44% | 0.54% |
Demographics Similar to Immigrants from Taiwan and Immigrants from Sri Lanka by Vision Disability
In terms of vision disability, the demographic groups most similar to Immigrants from Taiwan are Filipino (1.7%, a difference of 0.65%), Immigrants from India (1.7%, a difference of 0.71%), Thai (1.7%, a difference of 2.6%), Okinawan (1.8%, a difference of 4.6%), and Immigrants from Iran (1.8%, a difference of 5.2%). Similarly, the demographic groups most similar to Immigrants from Sri Lanka are Asian (1.9%, a difference of 1.1%), Bolivian (1.9%, a difference of 1.2%), Turkish (1.9%, a difference of 1.4%), Indian (Asian) (1.8%, a difference of 1.7%), and Burmese (1.8%, a difference of 1.7%).
| Demographics | Rating | Rank | Vision Disability |
| Immigrants | India | 100.0 /100 | #1 | Exceptional 1.7% |
| Filipinos | 100.0 /100 | #2 | Exceptional 1.7% |
| Immigrants | Taiwan | 100.0 /100 | #3 | Exceptional 1.7% |
| Thais | 100.0 /100 | #4 | Exceptional 1.7% |
| Okinawans | 100.0 /100 | #5 | Exceptional 1.8% |
| Immigrants | Iran | 100.0 /100 | #6 | Exceptional 1.8% |
| Immigrants | South Central Asia | 100.0 /100 | #7 | Exceptional 1.8% |
| Iranians | 100.0 /100 | #8 | Exceptional 1.8% |
| Immigrants | Singapore | 100.0 /100 | #9 | Exceptional 1.8% |
| Immigrants | Hong Kong | 100.0 /100 | #10 | Exceptional 1.8% |
| Immigrants | Israel | 100.0 /100 | #11 | Exceptional 1.8% |
| Immigrants | Korea | 100.0 /100 | #12 | Exceptional 1.8% |
| Immigrants | Eastern Asia | 100.0 /100 | #13 | Exceptional 1.8% |
| Immigrants | China | 100.0 /100 | #14 | Exceptional 1.8% |
| Immigrants | Bolivia | 100.0 /100 | #15 | Exceptional 1.8% |
| Indians (Asian) | 100.0 /100 | #16 | Exceptional 1.8% |
| Burmese | 100.0 /100 | #17 | Exceptional 1.8% |
| Bolivians | 100.0 /100 | #18 | Exceptional 1.9% |
| Immigrants | Sri Lanka | 100.0 /100 | #19 | Exceptional 1.9% |
| Asians | 100.0 /100 | #20 | Exceptional 1.9% |
| Turks | 100.0 /100 | #21 | Exceptional 1.9% |