Immigrants from St. Vincent and the Grenadines vs Scottish Wage/Income Gap
COMPARE
Immigrants from St. Vincent and the Grenadines
Scottish
Wage/Income Gap
Wage/Income Gap Comparison
Immigrants from St. Vincent and the Grenadines
Scottish
16.4%
WAGE/INCOME GAP
100.0/ 100
METRIC RATING
2nd/ 347
METRIC RANK
29.1%
WAGE/INCOME GAP
0.0/ 100
METRIC RATING
329th/ 347
METRIC RANK
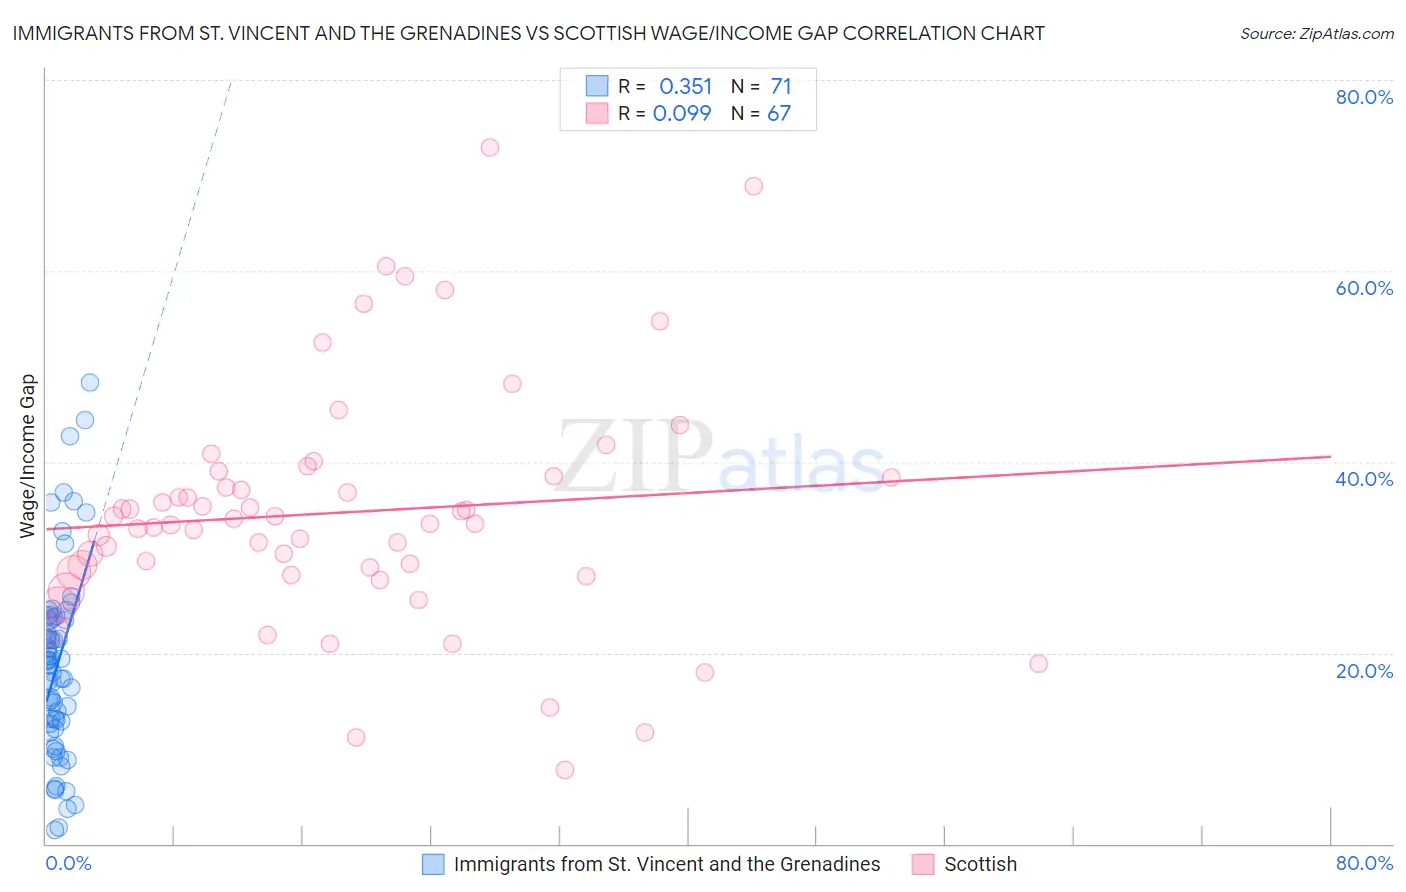
Immigrants from St. Vincent and the Grenadines vs Scottish Wage/Income Gap Correlation Chart
The statistical analysis conducted on geographies consisting of 56,186,231 people shows a mild positive correlation between the proportion of Immigrants from St. Vincent and the Grenadines and wage/income gap percentage in the United States with a correlation coefficient (R) of 0.351 and weighted average of 16.4%. Similarly, the statistical analysis conducted on geographies consisting of 564,295,282 people shows a slight positive correlation between the proportion of Scottish and wage/income gap percentage in the United States with a correlation coefficient (R) of 0.099 and weighted average of 29.1%, a difference of 77.4%.
Wage/Income Gap Correlation Summary
| Measurement | Immigrants from St. Vincent and the Grenadines | Scottish |
| Minimum | 1.4% | 7.8% |
| Maximum | 48.3% | 73.0% |
| Range | 46.9% | 65.2% |
| Mean | 18.8% | 34.7% |
| Median | 18.8% | 33.5% |
| Interquartile 25% (IQ1) | 12.5% | 28.4% |
| Interquartile 75% (IQ3) | 23.7% | 38.5% |
| Interquartile Range (IQR) | 11.2% | 10.1% |
| Standard Deviation (Sample) | 9.8% | 12.5% |
| Standard Deviation (Population) | 9.8% | 12.4% |
Similar Demographics by Wage/Income Gap
Demographics Similar to Immigrants from St. Vincent and the Grenadines by Wage/Income Gap
In terms of wage/income gap, the demographic groups most similar to Immigrants from St. Vincent and the Grenadines are Immigrants from Grenada (16.2%, a difference of 1.5%), Immigrants from Barbados (17.8%, a difference of 8.6%), British West Indian (18.0%, a difference of 9.7%), Guyanese (18.3%, a difference of 11.5%), and Immigrants from Guyana (18.4%, a difference of 11.8%).
| Demographics | Rating | Rank | Wage/Income Gap |
| Immigrants | Grenada | 100.0 /100 | #1 | Exceptional 16.2% |
| Immigrants | St. Vincent and the Grenadines | 100.0 /100 | #2 | Exceptional 16.4% |
| Immigrants | Barbados | 100.0 /100 | #3 | Exceptional 17.8% |
| British West Indians | 100.0 /100 | #4 | Exceptional 18.0% |
| Guyanese | 100.0 /100 | #5 | Exceptional 18.3% |
| Immigrants | Guyana | 100.0 /100 | #6 | Exceptional 18.4% |
| Puerto Ricans | 100.0 /100 | #7 | Exceptional 18.7% |
| Immigrants | Jamaica | 100.0 /100 | #8 | Exceptional 18.8% |
| Barbadians | 100.0 /100 | #9 | Exceptional 19.0% |
| Crow | 100.0 /100 | #10 | Exceptional 19.1% |
| Immigrants | Haiti | 100.0 /100 | #11 | Exceptional 19.2% |
| Immigrants | West Indies | 100.0 /100 | #12 | Exceptional 19.2% |
| Trinidadians and Tobagonians | 100.0 /100 | #13 | Exceptional 19.3% |
| Immigrants | Trinidad and Tobago | 100.0 /100 | #14 | Exceptional 19.3% |
| West Indians | 100.0 /100 | #15 | Exceptional 19.6% |
Demographics Similar to Scottish by Wage/Income Gap
In terms of wage/income gap, the demographic groups most similar to Scottish are German (29.2%, a difference of 0.10%), Scandinavian (29.1%, a difference of 0.14%), Czech (29.2%, a difference of 0.15%), Immigrants from Iran (29.1%, a difference of 0.20%), and Immigrants from Belgium (29.0%, a difference of 0.31%).
| Demographics | Rating | Rank | Wage/Income Gap |
| Immigrants | Singapore | 0.1 /100 | #322 | Tragic 28.9% |
| Norwegians | 0.1 /100 | #323 | Tragic 29.0% |
| Croatians | 0.0 /100 | #324 | Tragic 29.0% |
| Hungarians | 0.0 /100 | #325 | Tragic 29.0% |
| Immigrants | Belgium | 0.0 /100 | #326 | Tragic 29.0% |
| Immigrants | Iran | 0.0 /100 | #327 | Tragic 29.1% |
| Scandinavians | 0.0 /100 | #328 | Tragic 29.1% |
| Scottish | 0.0 /100 | #329 | Tragic 29.1% |
| Germans | 0.0 /100 | #330 | Tragic 29.2% |
| Czechs | 0.0 /100 | #331 | Tragic 29.2% |
| Immigrants | South Central Asia | 0.0 /100 | #332 | Tragic 29.3% |
| Europeans | 0.0 /100 | #333 | Tragic 29.4% |
| Swedes | 0.0 /100 | #334 | Tragic 29.4% |
| Immigrants | Taiwan | 0.0 /100 | #335 | Tragic 29.5% |
| English | 0.0 /100 | #336 | Tragic 29.5% |