Immigrants from South Eastern Asia vs Immigrants from Colombia Disability Age 5 to 17
COMPARE
Immigrants from South Eastern Asia
Immigrants from Colombia
Disability Age 5 to 17
Disability Age 5 to 17 Comparison
Immigrants from South Eastern Asia
Immigrants from Colombia
5.2%
DISABILITY AGE 5 TO 17
99.8/ 100
METRIC RATING
64th/ 347
METRIC RANK
5.4%
DISABILITY AGE 5 TO 17
92.9/ 100
METRIC RATING
132nd/ 347
METRIC RANK
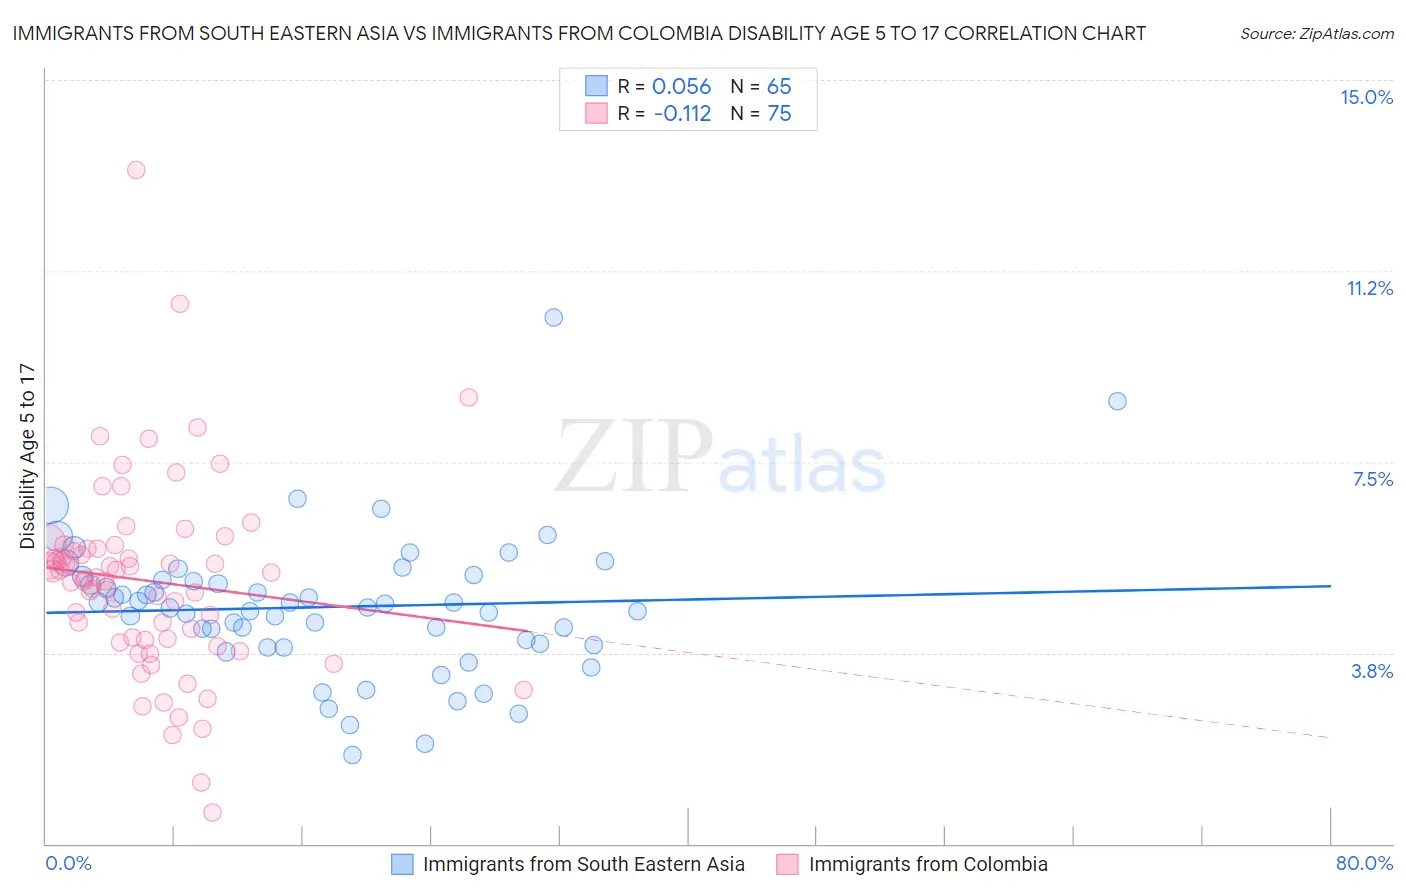
Immigrants from South Eastern Asia vs Immigrants from Colombia Disability Age 5 to 17 Correlation Chart
The statistical analysis conducted on geographies consisting of 505,803,855 people shows a slight positive correlation between the proportion of Immigrants from South Eastern Asia and percentage of population with a disability between the ages 5 and 17 in the United States with a correlation coefficient (R) of 0.056 and weighted average of 5.2%. Similarly, the statistical analysis conducted on geographies consisting of 376,032,819 people shows a poor negative correlation between the proportion of Immigrants from Colombia and percentage of population with a disability between the ages 5 and 17 in the United States with a correlation coefficient (R) of -0.112 and weighted average of 5.4%, a difference of 4.8%.
Disability Age 5 to 17 Correlation Summary
| Measurement | Immigrants from South Eastern Asia | Immigrants from Colombia |
| Minimum | 1.7% | 0.60% |
| Maximum | 10.3% | 13.2% |
| Range | 8.6% | 12.6% |
| Mean | 4.6% | 5.2% |
| Median | 4.6% | 5.2% |
| Interquartile 25% (IQ1) | 3.9% | 4.0% |
| Interquartile 75% (IQ3) | 5.2% | 5.8% |
| Interquartile Range (IQR) | 1.3% | 1.8% |
| Standard Deviation (Sample) | 1.4% | 1.9% |
| Standard Deviation (Population) | 1.4% | 1.9% |
Similar Demographics by Disability Age 5 to 17
Demographics Similar to Immigrants from South Eastern Asia by Disability Age 5 to 17
In terms of disability age 5 to 17, the demographic groups most similar to Immigrants from South Eastern Asia are Immigrants from Greece (5.2%, a difference of 0.010%), Immigrants from Bangladesh (5.2%, a difference of 0.030%), Palestinian (5.2%, a difference of 0.060%), Macedonian (5.2%, a difference of 0.080%), and Immigrants from Ireland (5.2%, a difference of 0.14%).
| Demographics | Rating | Rank | Disability Age 5 to 17 |
| Immigrants | Poland | 99.9 /100 | #57 | Exceptional 5.1% |
| Immigrants | Ukraine | 99.9 /100 | #58 | Exceptional 5.1% |
| Immigrants | North Macedonia | 99.9 /100 | #59 | Exceptional 5.1% |
| Immigrants | Eastern Europe | 99.9 /100 | #60 | Exceptional 5.1% |
| Immigrants | Switzerland | 99.8 /100 | #61 | Exceptional 5.2% |
| Immigrants | Ireland | 99.8 /100 | #62 | Exceptional 5.2% |
| Immigrants | Bangladesh | 99.8 /100 | #63 | Exceptional 5.2% |
| Immigrants | South Eastern Asia | 99.8 /100 | #64 | Exceptional 5.2% |
| Immigrants | Greece | 99.8 /100 | #65 | Exceptional 5.2% |
| Palestinians | 99.8 /100 | #66 | Exceptional 5.2% |
| Macedonians | 99.8 /100 | #67 | Exceptional 5.2% |
| Immigrants | Syria | 99.7 /100 | #68 | Exceptional 5.2% |
| Guyanese | 99.7 /100 | #69 | Exceptional 5.2% |
| Immigrants | Belgium | 99.7 /100 | #70 | Exceptional 5.2% |
| Jordanians | 99.7 /100 | #71 | Exceptional 5.2% |
Demographics Similar to Immigrants from Colombia by Disability Age 5 to 17
In terms of disability age 5 to 17, the demographic groups most similar to Immigrants from Colombia are Arab (5.4%, a difference of 0.020%), Venezuelan (5.4%, a difference of 0.030%), Yuman (5.4%, a difference of 0.11%), Immigrants from Belize (5.4%, a difference of 0.21%), and Immigrants from Bulgaria (5.4%, a difference of 0.25%).
| Demographics | Rating | Rank | Disability Age 5 to 17 |
| Immigrants | Chile | 95.0 /100 | #125 | Exceptional 5.4% |
| New Zealanders | 95.0 /100 | #126 | Exceptional 5.4% |
| Latvians | 95.0 /100 | #127 | Exceptional 5.4% |
| Immigrants | Venezuela | 94.5 /100 | #128 | Exceptional 5.4% |
| Romanians | 94.1 /100 | #129 | Exceptional 5.4% |
| Immigrants | Bulgaria | 94.0 /100 | #130 | Exceptional 5.4% |
| Arabs | 92.9 /100 | #131 | Exceptional 5.4% |
| Immigrants | Colombia | 92.9 /100 | #132 | Exceptional 5.4% |
| Venezuelans | 92.7 /100 | #133 | Exceptional 5.4% |
| Yuman | 92.3 /100 | #134 | Exceptional 5.4% |
| Immigrants | Belize | 91.7 /100 | #135 | Exceptional 5.4% |
| Immigrants | Denmark | 91.4 /100 | #136 | Exceptional 5.4% |
| Navajo | 90.9 /100 | #137 | Exceptional 5.4% |
| Immigrants | Oceania | 90.8 /100 | #138 | Exceptional 5.4% |
| Belizeans | 90.8 /100 | #139 | Exceptional 5.4% |