Immigrants from Haiti vs Immigrants from Colombia Disability Age 5 to 17
COMPARE
Immigrants from Haiti
Immigrants from Colombia
Disability Age 5 to 17
Disability Age 5 to 17 Comparison
Immigrants from Haiti
Immigrants from Colombia
5.8%
DISABILITY AGE 5 TO 17
9.5/ 100
METRIC RATING
210th/ 347
METRIC RANK
5.4%
DISABILITY AGE 5 TO 17
92.9/ 100
METRIC RATING
132nd/ 347
METRIC RANK
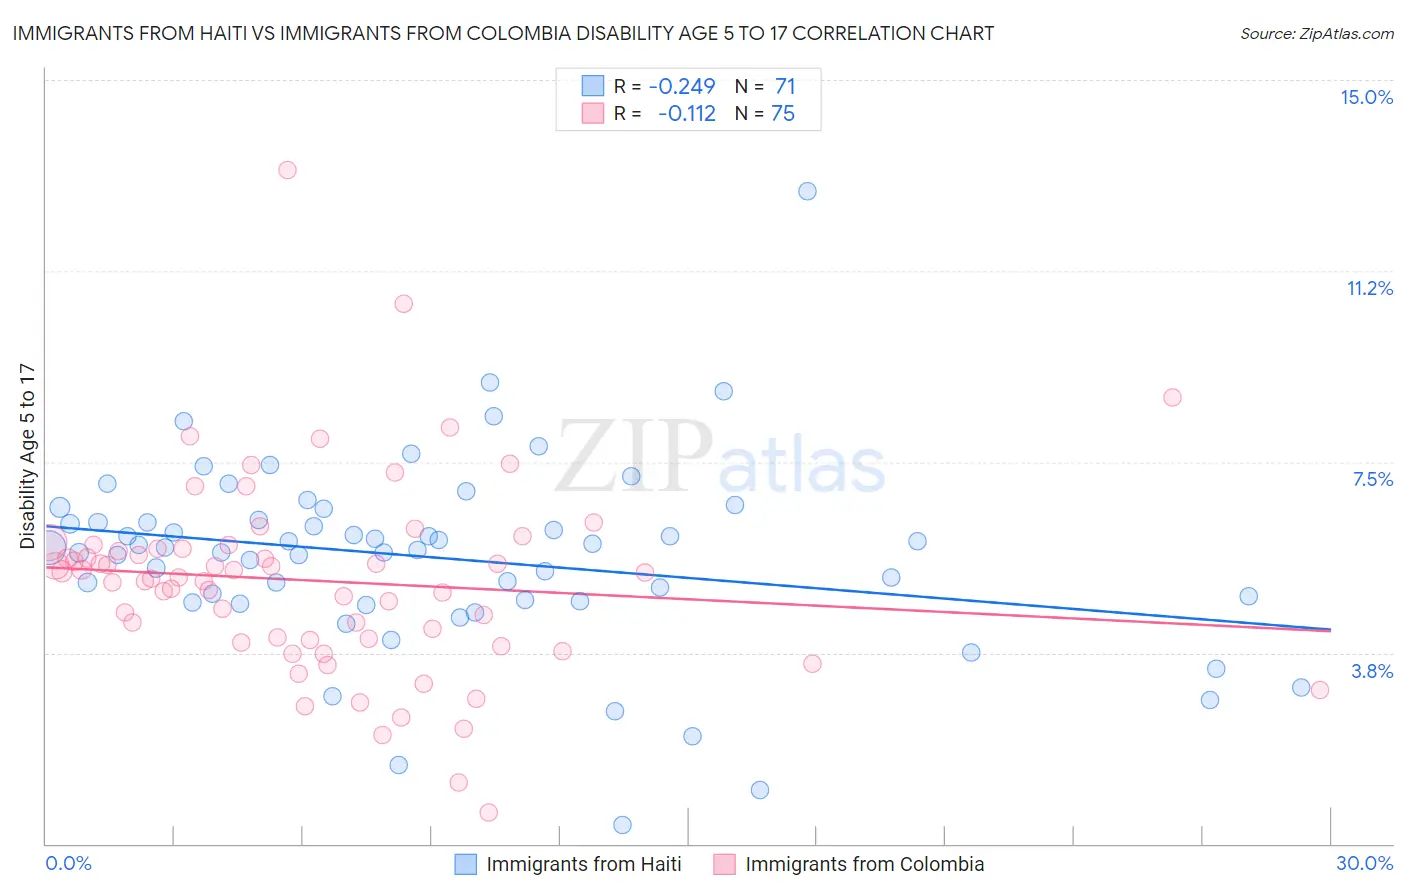
Immigrants from Haiti vs Immigrants from Colombia Disability Age 5 to 17 Correlation Chart
The statistical analysis conducted on geographies consisting of 224,112,942 people shows a weak negative correlation between the proportion of Immigrants from Haiti and percentage of population with a disability between the ages 5 and 17 in the United States with a correlation coefficient (R) of -0.249 and weighted average of 5.8%. Similarly, the statistical analysis conducted on geographies consisting of 376,032,819 people shows a poor negative correlation between the proportion of Immigrants from Colombia and percentage of population with a disability between the ages 5 and 17 in the United States with a correlation coefficient (R) of -0.112 and weighted average of 5.4%, a difference of 6.1%.
Disability Age 5 to 17 Correlation Summary
| Measurement | Immigrants from Haiti | Immigrants from Colombia |
| Minimum | 0.37% | 0.60% |
| Maximum | 12.8% | 13.2% |
| Range | 12.4% | 12.6% |
| Mean | 5.6% | 5.2% |
| Median | 5.8% | 5.2% |
| Interquartile 25% (IQ1) | 4.8% | 4.0% |
| Interquartile 75% (IQ3) | 6.4% | 5.8% |
| Interquartile Range (IQR) | 1.6% | 1.8% |
| Standard Deviation (Sample) | 1.9% | 1.9% |
| Standard Deviation (Population) | 1.9% | 1.9% |
Similar Demographics by Disability Age 5 to 17
Demographics Similar to Immigrants from Haiti by Disability Age 5 to 17
In terms of disability age 5 to 17, the demographic groups most similar to Immigrants from Haiti are Immigrants from Uganda (5.8%, a difference of 0.030%), Yugoslavian (5.8%, a difference of 0.050%), Kenyan (5.8%, a difference of 0.070%), Moroccan (5.7%, a difference of 0.12%), and Immigrants from Panama (5.8%, a difference of 0.12%).
| Demographics | Rating | Rank | Disability Age 5 to 17 |
| Spanish American Indians | 12.8 /100 | #203 | Poor 5.7% |
| Paiute | 11.2 /100 | #204 | Poor 5.7% |
| Trinidadians and Tobagonians | 10.8 /100 | #205 | Poor 5.7% |
| Immigrants | Africa | 10.8 /100 | #206 | Poor 5.7% |
| Moroccans | 10.4 /100 | #207 | Poor 5.7% |
| Kenyans | 10.0 /100 | #208 | Poor 5.8% |
| Immigrants | Uganda | 9.7 /100 | #209 | Tragic 5.8% |
| Immigrants | Haiti | 9.5 /100 | #210 | Tragic 5.8% |
| Yugoslavians | 9.1 /100 | #211 | Tragic 5.8% |
| Immigrants | Panama | 8.7 /100 | #212 | Tragic 5.8% |
| Immigrants | Cameroon | 8.3 /100 | #213 | Tragic 5.8% |
| Immigrants | Morocco | 8.3 /100 | #214 | Tragic 5.8% |
| Swedes | 8.1 /100 | #215 | Tragic 5.8% |
| Nigerians | 7.5 /100 | #216 | Tragic 5.8% |
| Czechs | 7.4 /100 | #217 | Tragic 5.8% |
Demographics Similar to Immigrants from Colombia by Disability Age 5 to 17
In terms of disability age 5 to 17, the demographic groups most similar to Immigrants from Colombia are Arab (5.4%, a difference of 0.020%), Venezuelan (5.4%, a difference of 0.030%), Yuman (5.4%, a difference of 0.11%), Immigrants from Belize (5.4%, a difference of 0.21%), and Immigrants from Bulgaria (5.4%, a difference of 0.25%).
| Demographics | Rating | Rank | Disability Age 5 to 17 |
| Immigrants | Chile | 95.0 /100 | #125 | Exceptional 5.4% |
| New Zealanders | 95.0 /100 | #126 | Exceptional 5.4% |
| Latvians | 95.0 /100 | #127 | Exceptional 5.4% |
| Immigrants | Venezuela | 94.5 /100 | #128 | Exceptional 5.4% |
| Romanians | 94.1 /100 | #129 | Exceptional 5.4% |
| Immigrants | Bulgaria | 94.0 /100 | #130 | Exceptional 5.4% |
| Arabs | 92.9 /100 | #131 | Exceptional 5.4% |
| Immigrants | Colombia | 92.9 /100 | #132 | Exceptional 5.4% |
| Venezuelans | 92.7 /100 | #133 | Exceptional 5.4% |
| Yuman | 92.3 /100 | #134 | Exceptional 5.4% |
| Immigrants | Belize | 91.7 /100 | #135 | Exceptional 5.4% |
| Immigrants | Denmark | 91.4 /100 | #136 | Exceptional 5.4% |
| Navajo | 90.9 /100 | #137 | Exceptional 5.4% |
| Immigrants | Oceania | 90.8 /100 | #138 | Exceptional 5.4% |
| Belizeans | 90.8 /100 | #139 | Exceptional 5.4% |