Immigrants from South Eastern Asia vs Immigrants from Lithuania Disability Age 5 to 17
COMPARE
Immigrants from South Eastern Asia
Immigrants from Lithuania
Disability Age 5 to 17
Disability Age 5 to 17 Comparison
Immigrants from South Eastern Asia
Immigrants from Lithuania
5.2%
DISABILITY AGE 5 TO 17
99.8/ 100
METRIC RATING
64th/ 347
METRIC RANK
5.1%
DISABILITY AGE 5 TO 17
99.9/ 100
METRIC RATING
53rd/ 347
METRIC RANK
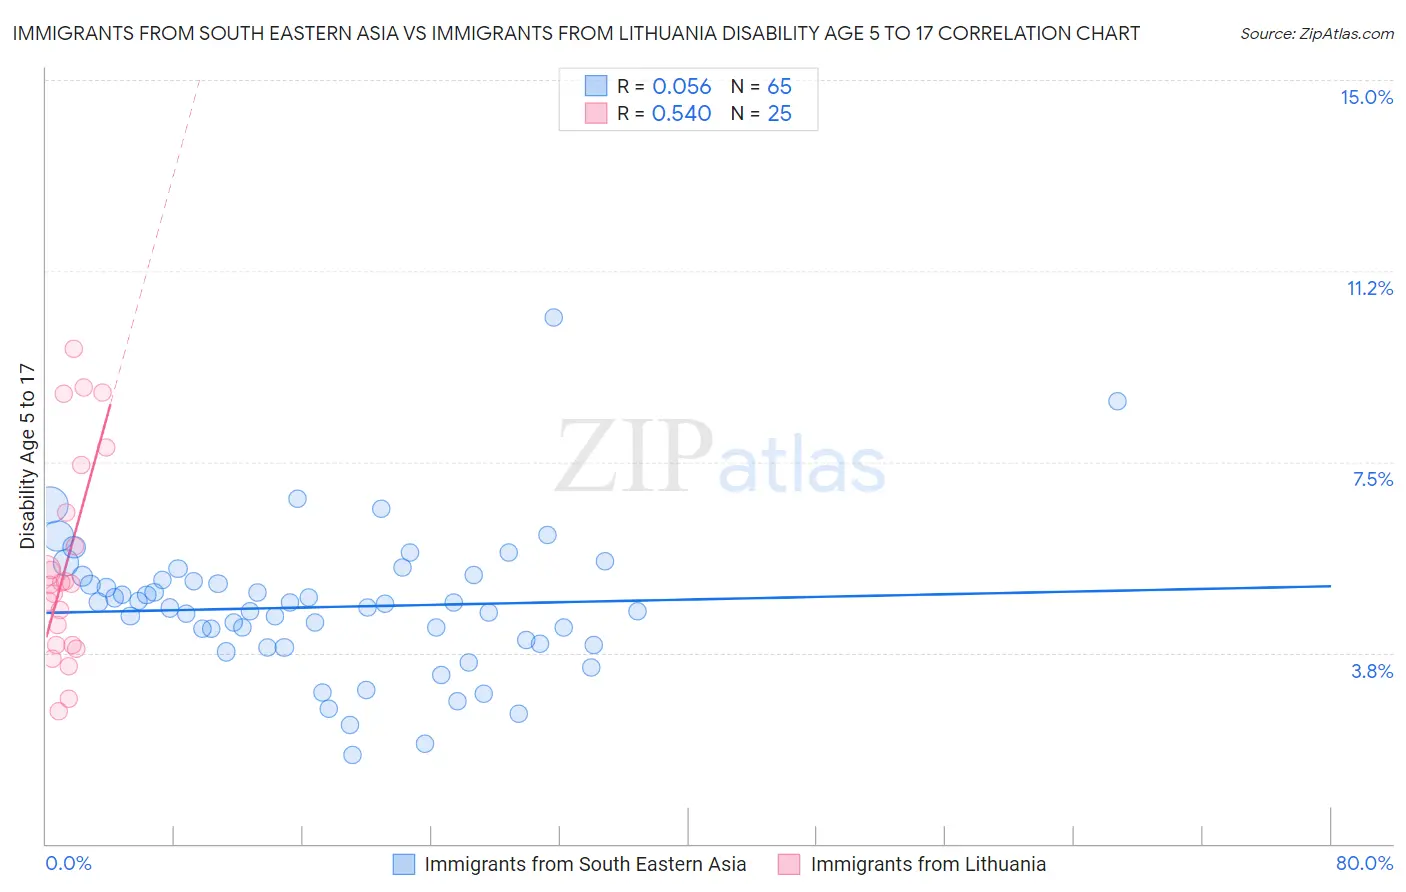
Immigrants from South Eastern Asia vs Immigrants from Lithuania Disability Age 5 to 17 Correlation Chart
The statistical analysis conducted on geographies consisting of 505,803,855 people shows a slight positive correlation between the proportion of Immigrants from South Eastern Asia and percentage of population with a disability between the ages 5 and 17 in the United States with a correlation coefficient (R) of 0.056 and weighted average of 5.2%. Similarly, the statistical analysis conducted on geographies consisting of 117,321,416 people shows a substantial positive correlation between the proportion of Immigrants from Lithuania and percentage of population with a disability between the ages 5 and 17 in the United States with a correlation coefficient (R) of 0.540 and weighted average of 5.1%, a difference of 1.3%.
Disability Age 5 to 17 Correlation Summary
| Measurement | Immigrants from South Eastern Asia | Immigrants from Lithuania |
| Minimum | 1.7% | 2.6% |
| Maximum | 10.3% | 9.7% |
| Range | 8.6% | 7.1% |
| Mean | 4.6% | 5.5% |
| Median | 4.6% | 5.1% |
| Interquartile 25% (IQ1) | 3.9% | 3.9% |
| Interquartile 75% (IQ3) | 5.2% | 7.0% |
| Interquartile Range (IQR) | 1.3% | 3.1% |
| Standard Deviation (Sample) | 1.4% | 2.0% |
| Standard Deviation (Population) | 1.4% | 2.0% |
Demographics Similar to Immigrants from South Eastern Asia and Immigrants from Lithuania by Disability Age 5 to 17
In terms of disability age 5 to 17, the demographic groups most similar to Immigrants from South Eastern Asia are Immigrants from Greece (5.2%, a difference of 0.010%), Immigrants from Bangladesh (5.2%, a difference of 0.030%), Palestinian (5.2%, a difference of 0.060%), Macedonian (5.2%, a difference of 0.080%), and Immigrants from Ireland (5.2%, a difference of 0.14%). Similarly, the demographic groups most similar to Immigrants from Lithuania are Paraguayan (5.1%, a difference of 0.030%), Immigrants from Fiji (5.1%, a difference of 0.050%), Laotian (5.1%, a difference of 0.070%), Immigrants from Turkey (5.1%, a difference of 0.090%), and Turkish (5.1%, a difference of 0.14%).
| Demographics | Rating | Rank | Disability Age 5 to 17 |
| Koreans | 100.0 /100 | #48 | Exceptional 5.1% |
| Immigrants | Western Asia | 100.0 /100 | #49 | Exceptional 5.1% |
| Argentineans | 99.9 /100 | #50 | Exceptional 5.1% |
| Turks | 99.9 /100 | #51 | Exceptional 5.1% |
| Immigrants | Fiji | 99.9 /100 | #52 | Exceptional 5.1% |
| Immigrants | Lithuania | 99.9 /100 | #53 | Exceptional 5.1% |
| Paraguayans | 99.9 /100 | #54 | Exceptional 5.1% |
| Laotians | 99.9 /100 | #55 | Exceptional 5.1% |
| Immigrants | Turkey | 99.9 /100 | #56 | Exceptional 5.1% |
| Immigrants | Poland | 99.9 /100 | #57 | Exceptional 5.1% |
| Immigrants | Ukraine | 99.9 /100 | #58 | Exceptional 5.1% |
| Immigrants | North Macedonia | 99.9 /100 | #59 | Exceptional 5.1% |
| Immigrants | Eastern Europe | 99.9 /100 | #60 | Exceptional 5.1% |
| Immigrants | Switzerland | 99.8 /100 | #61 | Exceptional 5.2% |
| Immigrants | Ireland | 99.8 /100 | #62 | Exceptional 5.2% |
| Immigrants | Bangladesh | 99.8 /100 | #63 | Exceptional 5.2% |
| Immigrants | South Eastern Asia | 99.8 /100 | #64 | Exceptional 5.2% |
| Immigrants | Greece | 99.8 /100 | #65 | Exceptional 5.2% |
| Palestinians | 99.8 /100 | #66 | Exceptional 5.2% |
| Macedonians | 99.8 /100 | #67 | Exceptional 5.2% |
| Immigrants | Syria | 99.7 /100 | #68 | Exceptional 5.2% |