Immigrants from Norway vs Immigrants from Colombia Disability Age 5 to 17
COMPARE
Immigrants from Norway
Immigrants from Colombia
Disability Age 5 to 17
Disability Age 5 to 17 Comparison
Immigrants from Norway
Immigrants from Colombia
5.6%
DISABILITY AGE 5 TO 17
55.7/ 100
METRIC RATING
169th/ 347
METRIC RANK
5.4%
DISABILITY AGE 5 TO 17
92.9/ 100
METRIC RATING
132nd/ 347
METRIC RANK
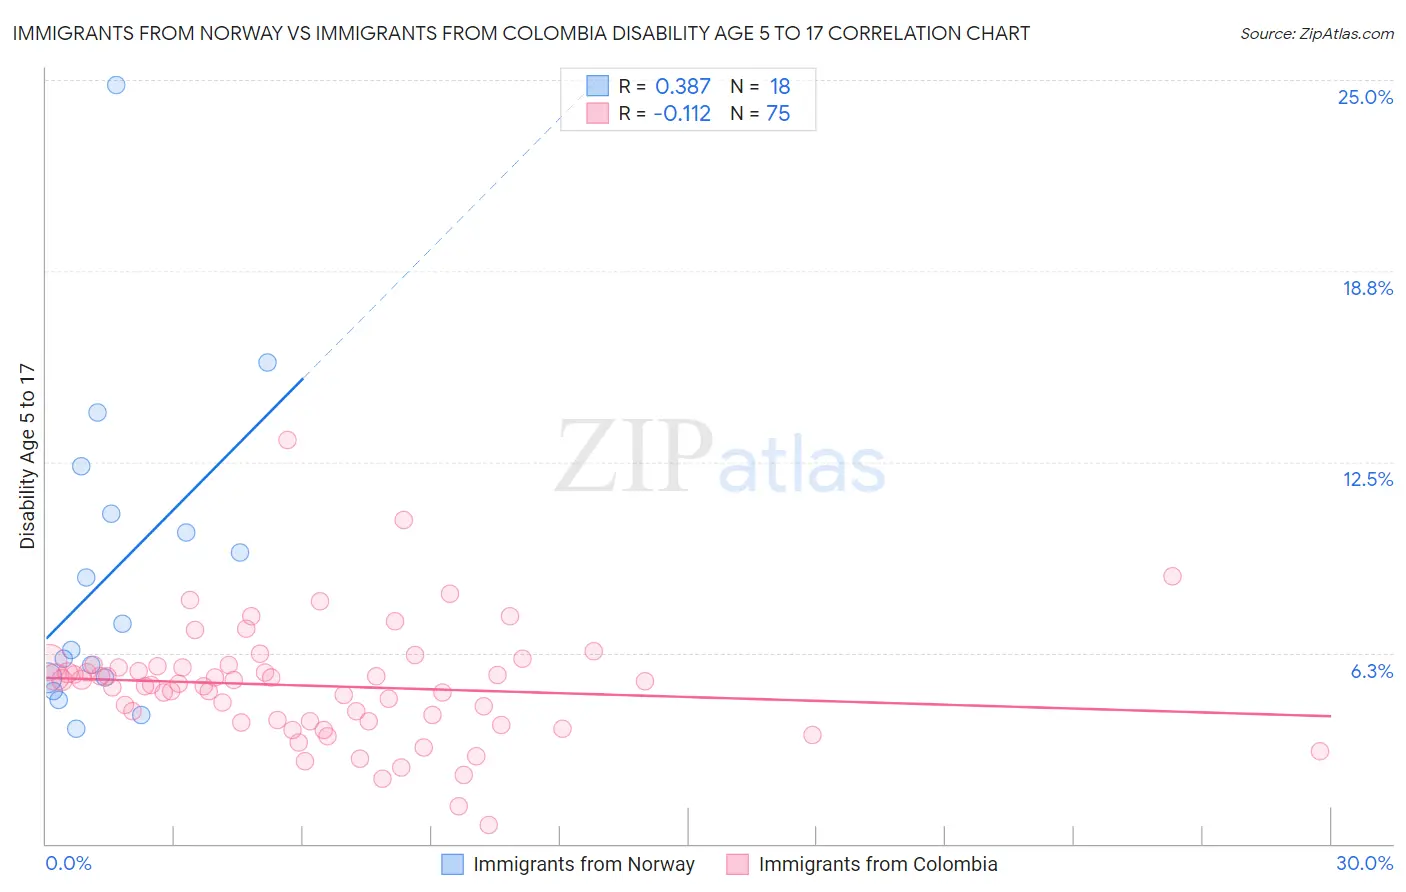
Immigrants from Norway vs Immigrants from Colombia Disability Age 5 to 17 Correlation Chart
The statistical analysis conducted on geographies consisting of 116,209,294 people shows a mild positive correlation between the proportion of Immigrants from Norway and percentage of population with a disability between the ages 5 and 17 in the United States with a correlation coefficient (R) of 0.387 and weighted average of 5.6%. Similarly, the statistical analysis conducted on geographies consisting of 376,032,819 people shows a poor negative correlation between the proportion of Immigrants from Colombia and percentage of population with a disability between the ages 5 and 17 in the United States with a correlation coefficient (R) of -0.112 and weighted average of 5.4%, a difference of 3.0%.
Disability Age 5 to 17 Correlation Summary
| Measurement | Immigrants from Norway | Immigrants from Colombia |
| Minimum | 3.8% | 0.60% |
| Maximum | 24.8% | 13.2% |
| Range | 21.1% | 12.6% |
| Mean | 8.9% | 5.2% |
| Median | 6.8% | 5.2% |
| Interquartile 25% (IQ1) | 5.4% | 4.0% |
| Interquartile 75% (IQ3) | 10.8% | 5.8% |
| Interquartile Range (IQR) | 5.4% | 1.8% |
| Standard Deviation (Sample) | 5.3% | 1.9% |
| Standard Deviation (Population) | 5.1% | 1.9% |
Similar Demographics by Disability Age 5 to 17
Demographics Similar to Immigrants from Norway by Disability Age 5 to 17
In terms of disability age 5 to 17, the demographic groups most similar to Immigrants from Norway are Iraqi (5.6%, a difference of 0.020%), Serbian (5.6%, a difference of 0.080%), Immigrants from Iraq (5.6%, a difference of 0.090%), Immigrants from Burma/Myanmar (5.6%, a difference of 0.18%), and Ukrainian (5.6%, a difference of 0.21%).
| Demographics | Rating | Rank | Disability Age 5 to 17 |
| Zimbabweans | 67.2 /100 | #162 | Good 5.5% |
| Immigrants | Southern Europe | 64.0 /100 | #163 | Good 5.6% |
| Immigrants | Scotland | 61.9 /100 | #164 | Good 5.6% |
| Lebanese | 61.4 /100 | #165 | Good 5.6% |
| Greeks | 60.6 /100 | #166 | Good 5.6% |
| Immigrants | Burma/Myanmar | 59.3 /100 | #167 | Average 5.6% |
| Iraqis | 56.0 /100 | #168 | Average 5.6% |
| Immigrants | Norway | 55.7 /100 | #169 | Average 5.6% |
| Serbians | 54.0 /100 | #170 | Average 5.6% |
| Immigrants | Iraq | 53.9 /100 | #171 | Average 5.6% |
| Ukrainians | 51.5 /100 | #172 | Average 5.6% |
| Uruguayans | 51.0 /100 | #173 | Average 5.6% |
| Costa Ricans | 50.0 /100 | #174 | Average 5.6% |
| Shoshone | 49.4 /100 | #175 | Average 5.6% |
| Immigrants | Central America | 49.4 /100 | #176 | Average 5.6% |
Demographics Similar to Immigrants from Colombia by Disability Age 5 to 17
In terms of disability age 5 to 17, the demographic groups most similar to Immigrants from Colombia are Arab (5.4%, a difference of 0.020%), Venezuelan (5.4%, a difference of 0.030%), Yuman (5.4%, a difference of 0.11%), Immigrants from Belize (5.4%, a difference of 0.21%), and Immigrants from Bulgaria (5.4%, a difference of 0.25%).
| Demographics | Rating | Rank | Disability Age 5 to 17 |
| Immigrants | Chile | 95.0 /100 | #125 | Exceptional 5.4% |
| New Zealanders | 95.0 /100 | #126 | Exceptional 5.4% |
| Latvians | 95.0 /100 | #127 | Exceptional 5.4% |
| Immigrants | Venezuela | 94.5 /100 | #128 | Exceptional 5.4% |
| Romanians | 94.1 /100 | #129 | Exceptional 5.4% |
| Immigrants | Bulgaria | 94.0 /100 | #130 | Exceptional 5.4% |
| Arabs | 92.9 /100 | #131 | Exceptional 5.4% |
| Immigrants | Colombia | 92.9 /100 | #132 | Exceptional 5.4% |
| Venezuelans | 92.7 /100 | #133 | Exceptional 5.4% |
| Yuman | 92.3 /100 | #134 | Exceptional 5.4% |
| Immigrants | Belize | 91.7 /100 | #135 | Exceptional 5.4% |
| Immigrants | Denmark | 91.4 /100 | #136 | Exceptional 5.4% |
| Navajo | 90.9 /100 | #137 | Exceptional 5.4% |
| Immigrants | Oceania | 90.8 /100 | #138 | Exceptional 5.4% |
| Belizeans | 90.8 /100 | #139 | Exceptional 5.4% |