Immigrants from South Eastern Asia vs Dutch Disability
COMPARE
Immigrants from South Eastern Asia
Dutch
Disability
Disability Comparison
Immigrants from South Eastern Asia
Dutch
11.3%
DISABILITY
95.4/ 100
METRIC RATING
111th/ 347
METRIC RANK
12.8%
DISABILITY
0.0/ 100
METRIC RATING
277th/ 347
METRIC RANK
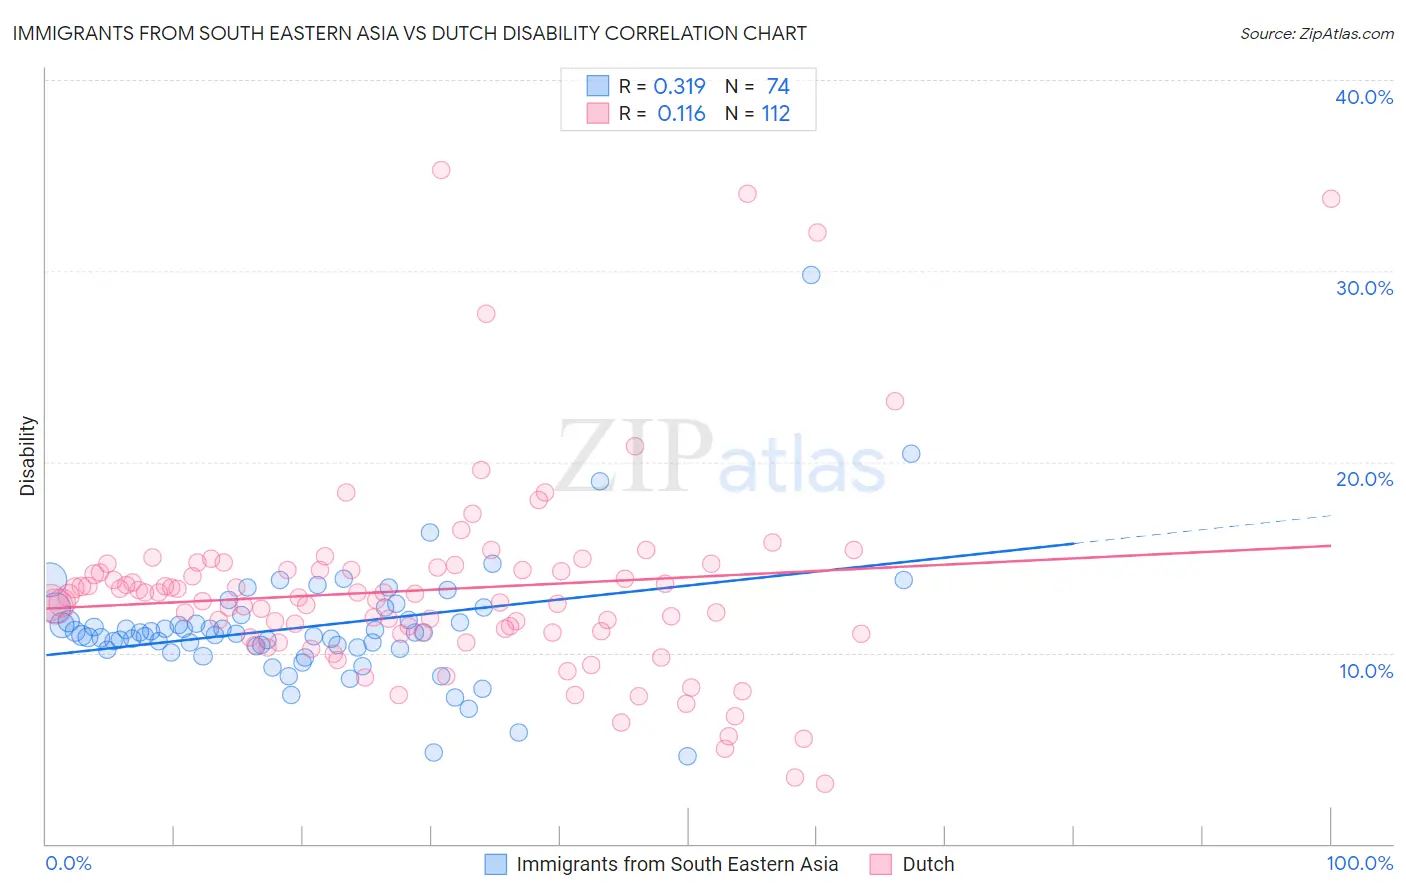
Immigrants from South Eastern Asia vs Dutch Disability Correlation Chart
The statistical analysis conducted on geographies consisting of 512,586,724 people shows a mild positive correlation between the proportion of Immigrants from South Eastern Asia and percentage of population with a disability in the United States with a correlation coefficient (R) of 0.319 and weighted average of 11.3%. Similarly, the statistical analysis conducted on geographies consisting of 554,259,467 people shows a poor positive correlation between the proportion of Dutch and percentage of population with a disability in the United States with a correlation coefficient (R) of 0.116 and weighted average of 12.8%, a difference of 13.2%.
Disability Correlation Summary
| Measurement | Immigrants from South Eastern Asia | Dutch |
| Minimum | 4.6% | 3.1% |
| Maximum | 29.8% | 35.3% |
| Range | 25.2% | 32.1% |
| Mean | 11.4% | 13.3% |
| Median | 11.0% | 12.8% |
| Interquartile 25% (IQ1) | 10.3% | 11.0% |
| Interquartile 75% (IQ3) | 12.0% | 14.4% |
| Interquartile Range (IQR) | 1.7% | 3.3% |
| Standard Deviation (Sample) | 3.3% | 5.3% |
| Standard Deviation (Population) | 3.3% | 5.3% |
Similar Demographics by Disability
Demographics Similar to Immigrants from South Eastern Asia by Disability
In terms of disability, the demographic groups most similar to Immigrants from South Eastern Asia are Immigrants from Denmark (11.3%, a difference of 0.070%), Immigrants from Uganda (11.3%, a difference of 0.080%), Immigrants from Uzbekistan (11.3%, a difference of 0.12%), Guyanese (11.3%, a difference of 0.16%), and Immigrants from Nigeria (11.3%, a difference of 0.17%).
| Demographics | Rating | Rank | Disability |
| Immigrants | Immigrants | 96.4 /100 | #104 | Exceptional 11.3% |
| Immigrants | Kazakhstan | 96.4 /100 | #105 | Exceptional 11.3% |
| Immigrants | Eastern Europe | 96.3 /100 | #106 | Exceptional 11.3% |
| Nicaraguans | 96.2 /100 | #107 | Exceptional 11.3% |
| Immigrants | Nigeria | 96.0 /100 | #108 | Exceptional 11.3% |
| Immigrants | Uganda | 95.7 /100 | #109 | Exceptional 11.3% |
| Immigrants | Denmark | 95.6 /100 | #110 | Exceptional 11.3% |
| Immigrants | South Eastern Asia | 95.4 /100 | #111 | Exceptional 11.3% |
| Immigrants | Uzbekistan | 94.9 /100 | #112 | Exceptional 11.3% |
| Guyanese | 94.7 /100 | #113 | Exceptional 11.3% |
| Immigrants | Syria | 94.7 /100 | #114 | Exceptional 11.3% |
| Immigrants | Philippines | 94.6 /100 | #115 | Exceptional 11.3% |
| Immigrants | Northern Europe | 94.1 /100 | #116 | Exceptional 11.3% |
| Luxembourgers | 93.9 /100 | #117 | Exceptional 11.3% |
| Koreans | 93.8 /100 | #118 | Exceptional 11.3% |
Demographics Similar to Dutch by Disability
In terms of disability, the demographic groups most similar to Dutch are Hmong (12.8%, a difference of 0.050%), German (12.8%, a difference of 0.17%), Sioux (12.8%, a difference of 0.20%), Fijian (12.8%, a difference of 0.26%), and Nepalese (12.8%, a difference of 0.28%).
| Demographics | Rating | Rank | Disability |
| Portuguese | 0.1 /100 | #270 | Tragic 12.6% |
| Immigrants | Yemen | 0.1 /100 | #271 | Tragic 12.6% |
| Dominicans | 0.0 /100 | #272 | Tragic 12.7% |
| Finns | 0.0 /100 | #273 | Tragic 12.7% |
| Nepalese | 0.0 /100 | #274 | Tragic 12.8% |
| Sioux | 0.0 /100 | #275 | Tragic 12.8% |
| Hmong | 0.0 /100 | #276 | Tragic 12.8% |
| Dutch | 0.0 /100 | #277 | Tragic 12.8% |
| Germans | 0.0 /100 | #278 | Tragic 12.8% |
| Fijians | 0.0 /100 | #279 | Tragic 12.8% |
| Spanish | 0.0 /100 | #280 | Tragic 12.8% |
| Immigrants | Portugal | 0.0 /100 | #281 | Tragic 12.9% |
| Scottish | 0.0 /100 | #282 | Tragic 12.9% |
| Irish | 0.0 /100 | #283 | Tragic 12.9% |
| Welsh | 0.0 /100 | #284 | Tragic 12.9% |