Immigrants from South Eastern Asia vs Immigrants from Australia Disability
COMPARE
Immigrants from South Eastern Asia
Immigrants from Australia
Disability
Disability Comparison
Immigrants from South Eastern Asia
Immigrants from Australia
11.3%
DISABILITY
95.4/ 100
METRIC RATING
111th/ 347
METRIC RANK
10.8%
DISABILITY
99.9/ 100
METRIC RATING
41st/ 347
METRIC RANK
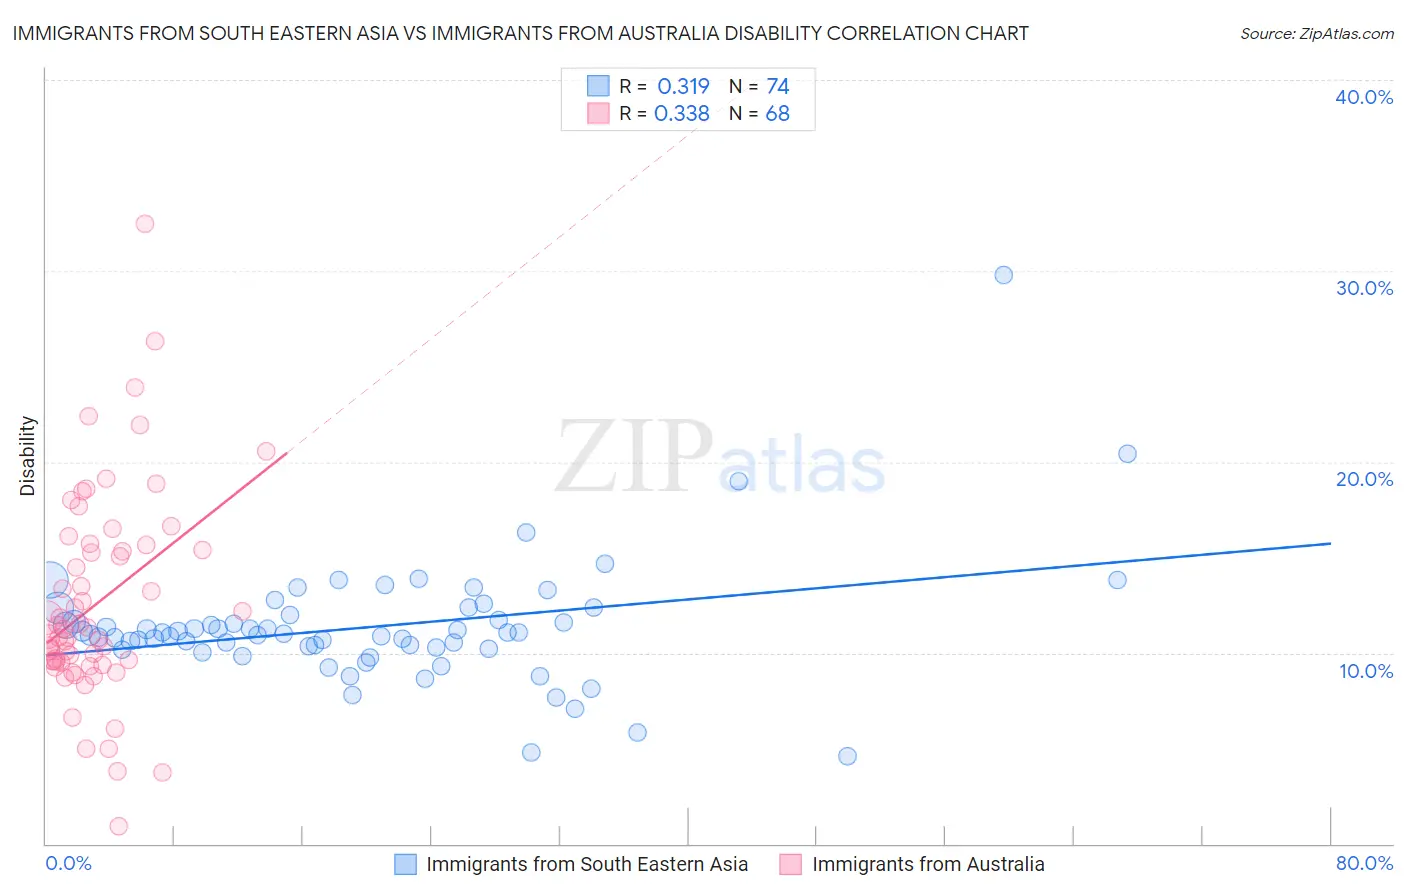
Immigrants from South Eastern Asia vs Immigrants from Australia Disability Correlation Chart
The statistical analysis conducted on geographies consisting of 512,586,724 people shows a mild positive correlation between the proportion of Immigrants from South Eastern Asia and percentage of population with a disability in the United States with a correlation coefficient (R) of 0.319 and weighted average of 11.3%. Similarly, the statistical analysis conducted on geographies consisting of 227,205,493 people shows a mild positive correlation between the proportion of Immigrants from Australia and percentage of population with a disability in the United States with a correlation coefficient (R) of 0.338 and weighted average of 10.8%, a difference of 5.0%.
Disability Correlation Summary
| Measurement | Immigrants from South Eastern Asia | Immigrants from Australia |
| Minimum | 4.6% | 0.92% |
| Maximum | 29.8% | 32.5% |
| Range | 25.2% | 31.6% |
| Mean | 11.4% | 12.6% |
| Median | 11.0% | 11.1% |
| Interquartile 25% (IQ1) | 10.3% | 9.5% |
| Interquartile 75% (IQ3) | 12.0% | 15.5% |
| Interquartile Range (IQR) | 1.7% | 6.0% |
| Standard Deviation (Sample) | 3.3% | 5.5% |
| Standard Deviation (Population) | 3.3% | 5.4% |
Similar Demographics by Disability
Demographics Similar to Immigrants from South Eastern Asia by Disability
In terms of disability, the demographic groups most similar to Immigrants from South Eastern Asia are Immigrants from Denmark (11.3%, a difference of 0.070%), Immigrants from Uganda (11.3%, a difference of 0.080%), Immigrants from Uzbekistan (11.3%, a difference of 0.12%), Guyanese (11.3%, a difference of 0.16%), and Immigrants from Nigeria (11.3%, a difference of 0.17%).
| Demographics | Rating | Rank | Disability |
| Immigrants | Immigrants | 96.4 /100 | #104 | Exceptional 11.3% |
| Immigrants | Kazakhstan | 96.4 /100 | #105 | Exceptional 11.3% |
| Immigrants | Eastern Europe | 96.3 /100 | #106 | Exceptional 11.3% |
| Nicaraguans | 96.2 /100 | #107 | Exceptional 11.3% |
| Immigrants | Nigeria | 96.0 /100 | #108 | Exceptional 11.3% |
| Immigrants | Uganda | 95.7 /100 | #109 | Exceptional 11.3% |
| Immigrants | Denmark | 95.6 /100 | #110 | Exceptional 11.3% |
| Immigrants | South Eastern Asia | 95.4 /100 | #111 | Exceptional 11.3% |
| Immigrants | Uzbekistan | 94.9 /100 | #112 | Exceptional 11.3% |
| Guyanese | 94.7 /100 | #113 | Exceptional 11.3% |
| Immigrants | Syria | 94.7 /100 | #114 | Exceptional 11.3% |
| Immigrants | Philippines | 94.6 /100 | #115 | Exceptional 11.3% |
| Immigrants | Northern Europe | 94.1 /100 | #116 | Exceptional 11.3% |
| Luxembourgers | 93.9 /100 | #117 | Exceptional 11.3% |
| Koreans | 93.8 /100 | #118 | Exceptional 11.3% |
Demographics Similar to Immigrants from Australia by Disability
In terms of disability, the demographic groups most similar to Immigrants from Australia are Cambodian (10.8%, a difference of 0.040%), Mongolian (10.8%, a difference of 0.040%), Immigrants from Nepal (10.8%, a difference of 0.10%), Afghan (10.8%, a difference of 0.15%), and Israeli (10.8%, a difference of 0.15%).
| Demographics | Rating | Rank | Disability |
| Immigrants | Ethiopia | 100.0 /100 | #34 | Exceptional 10.7% |
| Immigrants | Indonesia | 100.0 /100 | #35 | Exceptional 10.7% |
| Ethiopians | 100.0 /100 | #36 | Exceptional 10.7% |
| Turks | 100.0 /100 | #37 | Exceptional 10.7% |
| Afghans | 99.9 /100 | #38 | Exceptional 10.8% |
| Cambodians | 99.9 /100 | #39 | Exceptional 10.8% |
| Mongolians | 99.9 /100 | #40 | Exceptional 10.8% |
| Immigrants | Australia | 99.9 /100 | #41 | Exceptional 10.8% |
| Immigrants | Nepal | 99.9 /100 | #42 | Exceptional 10.8% |
| Israelis | 99.9 /100 | #43 | Exceptional 10.8% |
| Immigrants | Japan | 99.9 /100 | #44 | Exceptional 10.8% |
| Immigrants | Peru | 99.9 /100 | #45 | Exceptional 10.8% |
| Tongans | 99.9 /100 | #46 | Exceptional 10.8% |
| Taiwanese | 99.9 /100 | #47 | Exceptional 10.8% |
| Soviet Union | 99.9 /100 | #48 | Exceptional 10.9% |