Immigrants from Scotland vs Lithuanian Associate's Degree
COMPARE
Immigrants from Scotland
Lithuanian
Associate's Degree
Associate's Degree Comparison
Immigrants from Scotland
Lithuanians
50.6%
ASSOCIATE'S DEGREE
99.3/ 100
METRIC RATING
75th/ 347
METRIC RANK
50.6%
ASSOCIATE'S DEGREE
99.3/ 100
METRIC RATING
74th/ 347
METRIC RANK
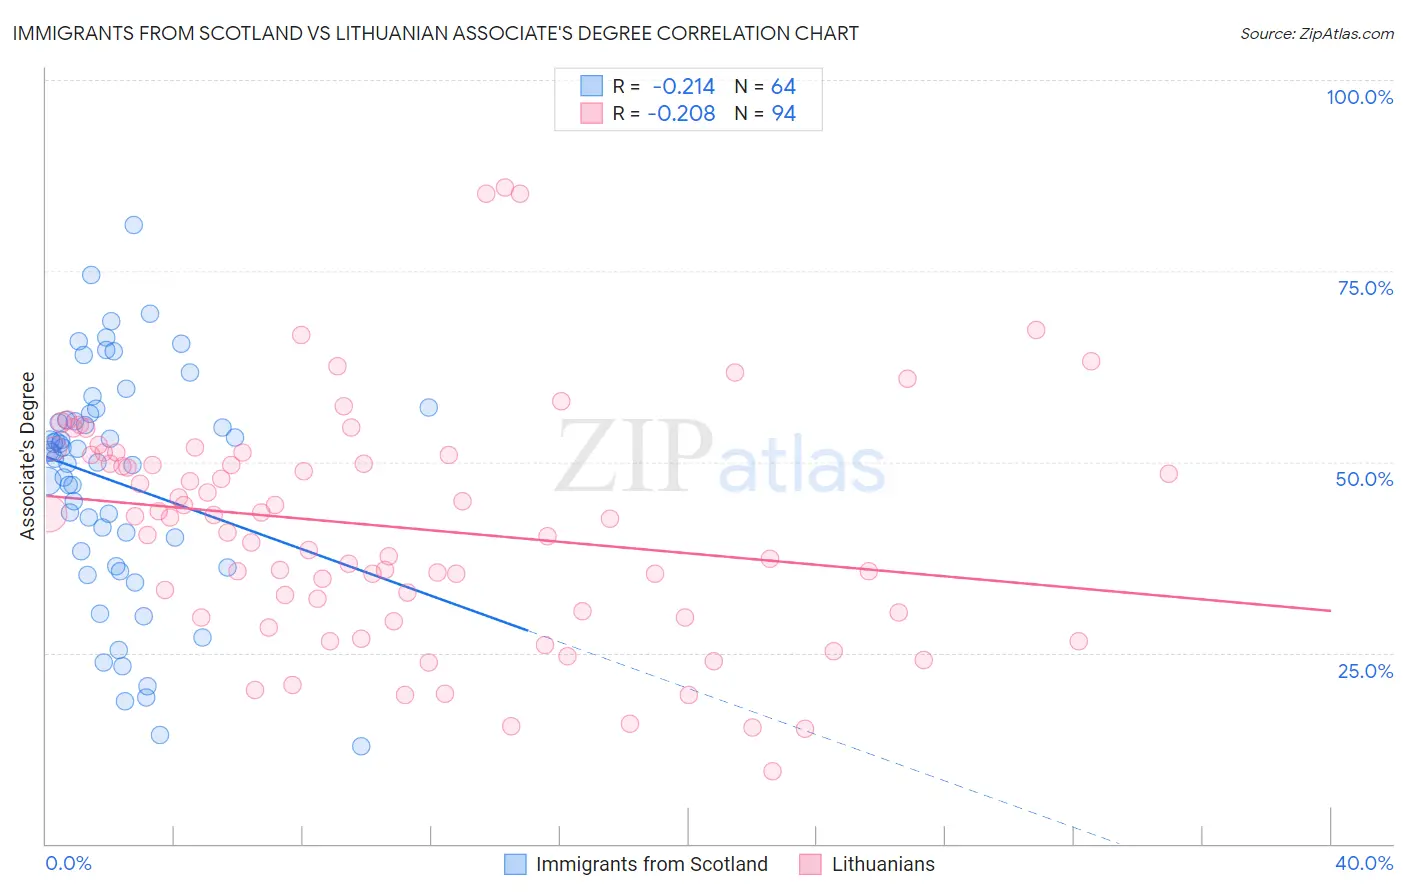
Immigrants from Scotland vs Lithuanian Associate's Degree Correlation Chart
The statistical analysis conducted on geographies consisting of 196,397,243 people shows a weak negative correlation between the proportion of Immigrants from Scotland and percentage of population with at least associate's degree education in the United States with a correlation coefficient (R) of -0.214 and weighted average of 50.6%. Similarly, the statistical analysis conducted on geographies consisting of 421,924,512 people shows a weak negative correlation between the proportion of Lithuanians and percentage of population with at least associate's degree education in the United States with a correlation coefficient (R) of -0.208 and weighted average of 50.6%, a difference of 0.040%.
Associate's Degree Correlation Summary
| Measurement | Immigrants from Scotland | Lithuanian |
| Minimum | 12.7% | 9.5% |
| Maximum | 81.0% | 85.9% |
| Range | 68.2% | 76.4% |
| Mean | 47.4% | 41.4% |
| Median | 50.9% | 42.6% |
| Interquartile 25% (IQ1) | 37.3% | 30.2% |
| Interquartile 75% (IQ3) | 55.9% | 50.9% |
| Interquartile Range (IQR) | 18.6% | 20.7% |
| Standard Deviation (Sample) | 15.1% | 15.3% |
| Standard Deviation (Population) | 14.9% | 15.3% |
Demographics Similar to Immigrants from Scotland and Lithuanians by Associate's Degree
In terms of associate's degree, the demographic groups most similar to Immigrants from Scotland are Carpatho Rusyn (50.6%, a difference of 0.10%), Immigrants from Zimbabwe (50.5%, a difference of 0.21%), Immigrants from Lebanon (50.5%, a difference of 0.24%), Immigrants from Eastern Europe (50.5%, a difference of 0.29%), and Ethiopian (50.4%, a difference of 0.30%). Similarly, the demographic groups most similar to Lithuanians are Carpatho Rusyn (50.6%, a difference of 0.060%), Immigrants from Zimbabwe (50.5%, a difference of 0.25%), Immigrants from Lebanon (50.5%, a difference of 0.28%), Immigrants from Eastern Europe (50.5%, a difference of 0.33%), and Ethiopian (50.4%, a difference of 0.34%).
| Demographics | Rating | Rank | Associate's Degree |
| Immigrants | Netherlands | 99.7 /100 | #64 | Exceptional 51.4% |
| Zimbabweans | 99.7 /100 | #65 | Exceptional 51.3% |
| Immigrants | Europe | 99.7 /100 | #66 | Exceptional 51.3% |
| Argentineans | 99.6 /100 | #67 | Exceptional 51.2% |
| Immigrants | Indonesia | 99.5 /100 | #68 | Exceptional 51.0% |
| Egyptians | 99.5 /100 | #69 | Exceptional 50.9% |
| Immigrants | Argentina | 99.5 /100 | #70 | Exceptional 50.9% |
| Immigrants | Romania | 99.5 /100 | #71 | Exceptional 50.9% |
| Immigrants | Pakistan | 99.5 /100 | #72 | Exceptional 50.9% |
| Carpatho Rusyns | 99.3 /100 | #73 | Exceptional 50.6% |
| Lithuanians | 99.3 /100 | #74 | Exceptional 50.6% |
| Immigrants | Scotland | 99.3 /100 | #75 | Exceptional 50.6% |
| Immigrants | Zimbabwe | 99.2 /100 | #76 | Exceptional 50.5% |
| Immigrants | Lebanon | 99.1 /100 | #77 | Exceptional 50.5% |
| Immigrants | Eastern Europe | 99.1 /100 | #78 | Exceptional 50.5% |
| Ethiopians | 99.1 /100 | #79 | Exceptional 50.4% |
| Armenians | 99.1 /100 | #80 | Exceptional 50.4% |
| Maltese | 99.1 /100 | #81 | Exceptional 50.4% |
| Greeks | 98.9 /100 | #82 | Exceptional 50.3% |
| Immigrants | Uzbekistan | 98.9 /100 | #83 | Exceptional 50.3% |
| Immigrants | Hungary | 98.9 /100 | #84 | Exceptional 50.2% |