Immigrants from Scotland vs Lithuanian Disability Age 65 to 74
COMPARE
Immigrants from Scotland
Lithuanian
Disability Age 65 to 74
Disability Age 65 to 74 Comparison
Immigrants from Scotland
Lithuanians
21.7%
DISABILITY AGE 65 TO 74
99.3/ 100
METRIC RATING
68th/ 347
METRIC RANK
21.4%
DISABILITY AGE 65 TO 74
99.7/ 100
METRIC RATING
48th/ 347
METRIC RANK
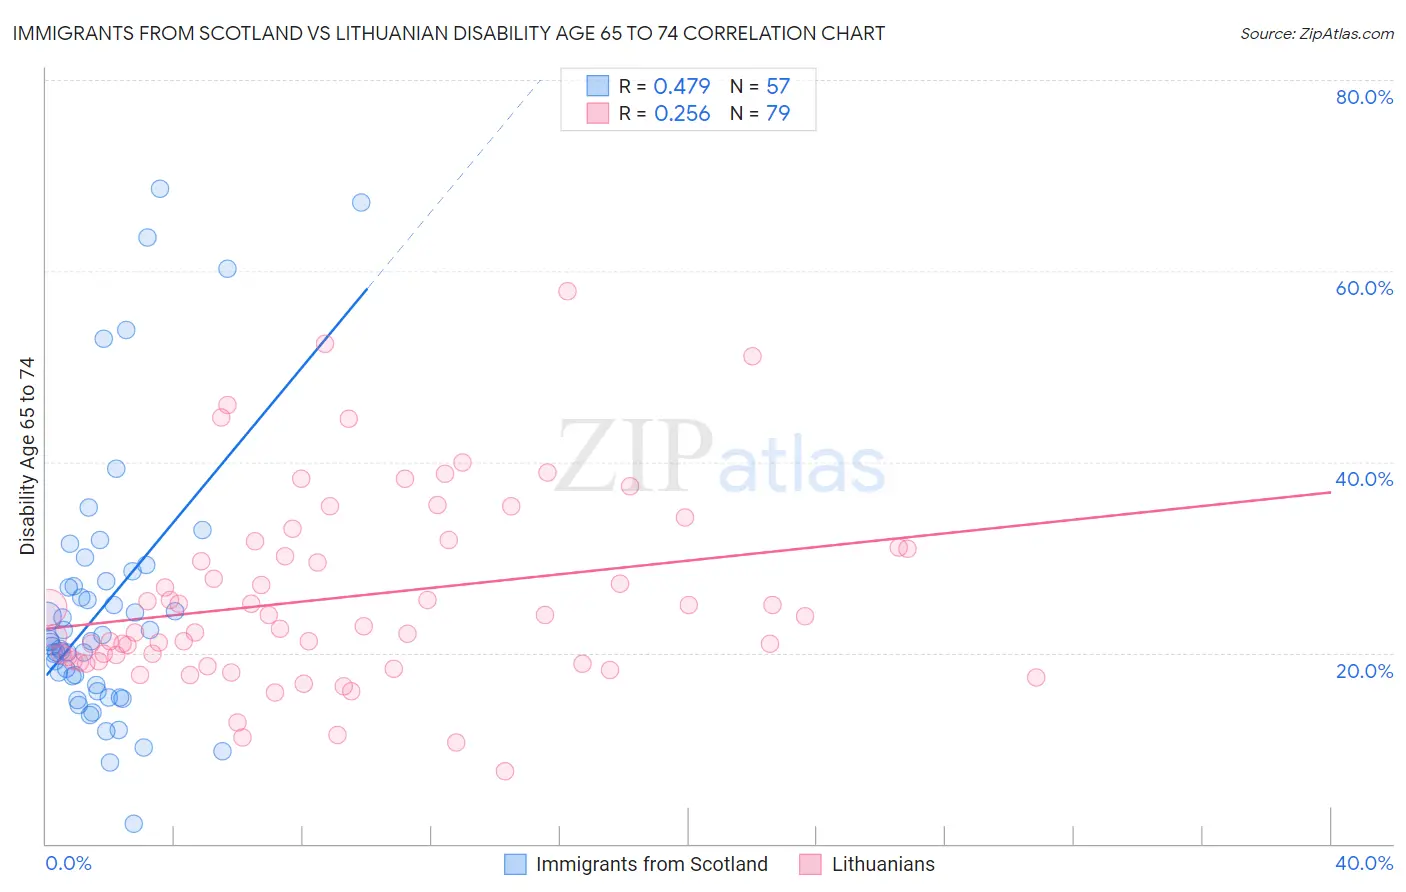
Immigrants from Scotland vs Lithuanian Disability Age 65 to 74 Correlation Chart
The statistical analysis conducted on geographies consisting of 196,345,839 people shows a moderate positive correlation between the proportion of Immigrants from Scotland and percentage of population with a disability between the ages 65 and 75 in the United States with a correlation coefficient (R) of 0.479 and weighted average of 21.7%. Similarly, the statistical analysis conducted on geographies consisting of 421,207,937 people shows a weak positive correlation between the proportion of Lithuanians and percentage of population with a disability between the ages 65 and 75 in the United States with a correlation coefficient (R) of 0.256 and weighted average of 21.4%, a difference of 1.3%.
Disability Age 65 to 74 Correlation Summary
| Measurement | Immigrants from Scotland | Lithuanian |
| Minimum | 2.1% | 7.6% |
| Maximum | 68.7% | 57.9% |
| Range | 66.6% | 50.3% |
| Mean | 25.1% | 25.8% |
| Median | 21.2% | 22.8% |
| Interquartile 25% (IQ1) | 16.3% | 19.1% |
| Interquartile 75% (IQ3) | 28.0% | 31.1% |
| Interquartile Range (IQR) | 11.7% | 12.0% |
| Standard Deviation (Sample) | 14.3% | 9.9% |
| Standard Deviation (Population) | 14.2% | 9.9% |
Demographics Similar to Immigrants from Scotland and Lithuanians by Disability Age 65 to 74
In terms of disability age 65 to 74, the demographic groups most similar to Immigrants from Scotland are Immigrants from South Africa (21.7%, a difference of 0.090%), Maltese (21.6%, a difference of 0.30%), Immigrants from Russia (21.6%, a difference of 0.31%), Immigrants from Latvia (21.6%, a difference of 0.32%), and Immigrants from Europe (21.6%, a difference of 0.40%). Similarly, the demographic groups most similar to Lithuanians are Luxembourger (21.4%, a difference of 0.010%), Immigrants from Malaysia (21.4%, a difference of 0.030%), Immigrants from Serbia (21.4%, a difference of 0.26%), Immigrants from France (21.5%, a difference of 0.48%), and Bhutanese (21.5%, a difference of 0.49%).
| Demographics | Rating | Rank | Disability Age 65 to 74 |
| Lithuanians | 99.7 /100 | #48 | Exceptional 21.4% |
| Luxembourgers | 99.7 /100 | #49 | Exceptional 21.4% |
| Immigrants | Malaysia | 99.7 /100 | #50 | Exceptional 21.4% |
| Immigrants | Serbia | 99.6 /100 | #51 | Exceptional 21.4% |
| Immigrants | France | 99.6 /100 | #52 | Exceptional 21.5% |
| Bhutanese | 99.6 /100 | #53 | Exceptional 21.5% |
| Immigrants | Italy | 99.6 /100 | #54 | Exceptional 21.5% |
| Immigrants | Romania | 99.5 /100 | #55 | Exceptional 21.5% |
| Immigrants | Denmark | 99.5 /100 | #56 | Exceptional 21.5% |
| Immigrants | Asia | 99.5 /100 | #57 | Exceptional 21.5% |
| Immigrants | Pakistan | 99.5 /100 | #58 | Exceptional 21.5% |
| Zimbabweans | 99.5 /100 | #59 | Exceptional 21.5% |
| Immigrants | North Macedonia | 99.5 /100 | #60 | Exceptional 21.6% |
| Egyptians | 99.5 /100 | #61 | Exceptional 21.6% |
| Carpatho Rusyns | 99.5 /100 | #62 | Exceptional 21.6% |
| Immigrants | Europe | 99.4 /100 | #63 | Exceptional 21.6% |
| Immigrants | Latvia | 99.4 /100 | #64 | Exceptional 21.6% |
| Immigrants | Russia | 99.4 /100 | #65 | Exceptional 21.6% |
| Maltese | 99.4 /100 | #66 | Exceptional 21.6% |
| Immigrants | South Africa | 99.3 /100 | #67 | Exceptional 21.7% |
| Immigrants | Scotland | 99.3 /100 | #68 | Exceptional 21.7% |