Immigrants from Scotland vs Bermudan Hearing Disability
COMPARE
Immigrants from Scotland
Bermudan
Hearing Disability
Hearing Disability Comparison
Immigrants from Scotland
Bermudans
3.3%
HEARING DISABILITY
0.8/ 100
METRIC RATING
245th/ 347
METRIC RANK
2.9%
HEARING DISABILITY
83.8/ 100
METRIC RATING
139th/ 347
METRIC RANK
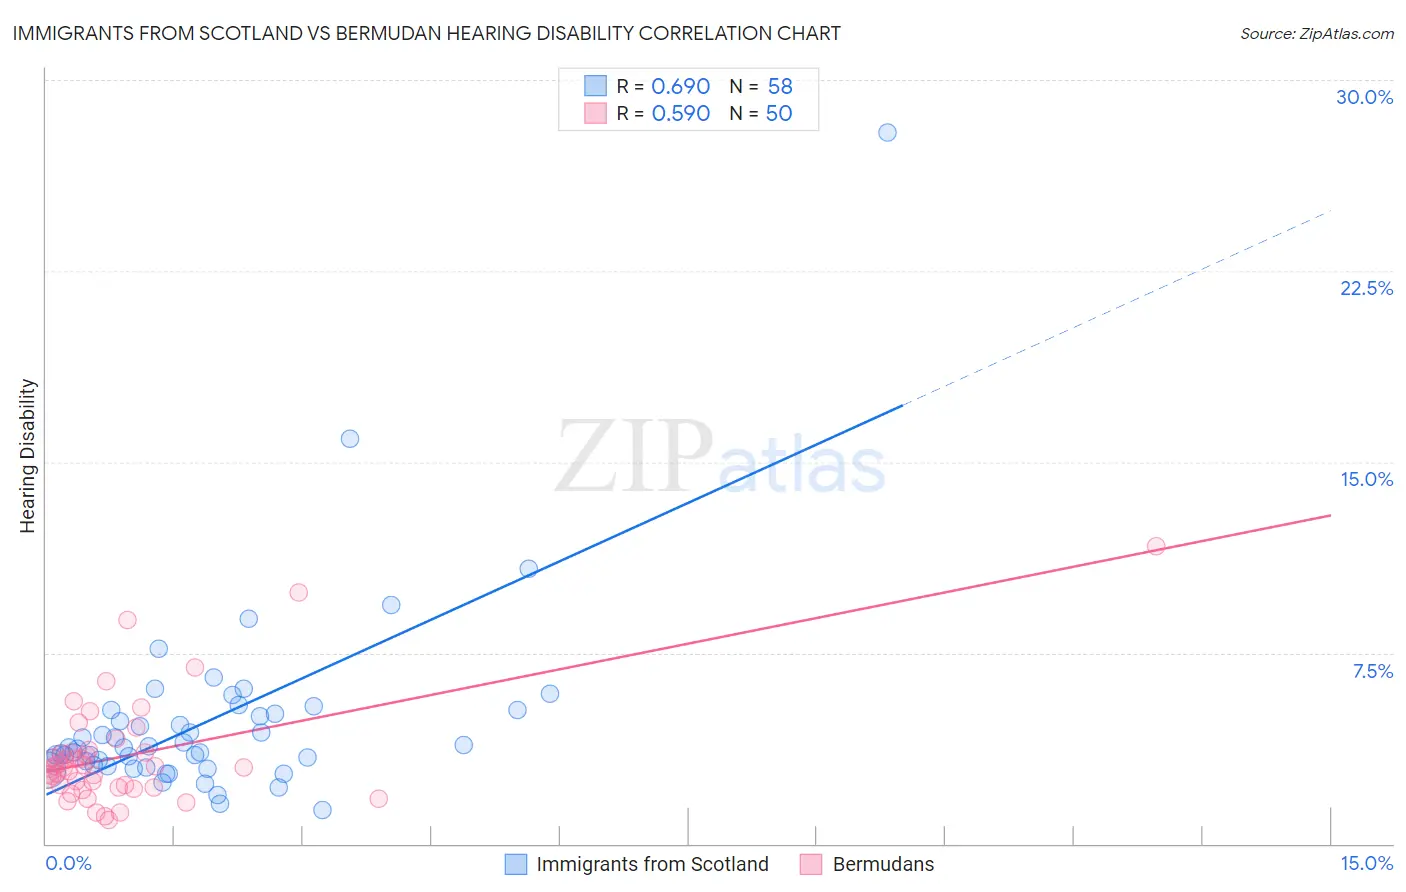
Immigrants from Scotland vs Bermudan Hearing Disability Correlation Chart
The statistical analysis conducted on geographies consisting of 196,388,915 people shows a significant positive correlation between the proportion of Immigrants from Scotland and percentage of population with hearing disability in the United States with a correlation coefficient (R) of 0.690 and weighted average of 3.3%. Similarly, the statistical analysis conducted on geographies consisting of 55,720,149 people shows a substantial positive correlation between the proportion of Bermudans and percentage of population with hearing disability in the United States with a correlation coefficient (R) of 0.590 and weighted average of 2.9%, a difference of 15.8%.
Hearing Disability Correlation Summary
| Measurement | Immigrants from Scotland | Bermudan |
| Minimum | 1.3% | 0.95% |
| Maximum | 27.9% | 11.7% |
| Range | 26.6% | 10.7% |
| Mean | 4.8% | 3.5% |
| Median | 3.8% | 3.0% |
| Interquartile 25% (IQ1) | 3.1% | 2.2% |
| Interquartile 75% (IQ3) | 5.2% | 3.6% |
| Interquartile Range (IQR) | 2.1% | 1.4% |
| Standard Deviation (Sample) | 3.9% | 2.1% |
| Standard Deviation (Population) | 3.9% | 2.1% |
Similar Demographics by Hearing Disability
Demographics Similar to Immigrants from Scotland by Hearing Disability
In terms of hearing disability, the demographic groups most similar to Immigrants from Scotland are Immigrants from England (3.3%, a difference of 0.28%), Assyrian/Chaldean/Syriac (3.3%, a difference of 0.34%), Immigrants from Western Europe (3.3%, a difference of 0.41%), Lithuanian (3.4%, a difference of 0.48%), and Yugoslavian (3.3%, a difference of 0.58%).
| Demographics | Rating | Rank | Hearing Disability |
| German Russians | 1.8 /100 | #238 | Tragic 3.3% |
| Nepalese | 1.2 /100 | #239 | Tragic 3.3% |
| Immigrants | Netherlands | 1.1 /100 | #240 | Tragic 3.3% |
| Samoans | 1.1 /100 | #241 | Tragic 3.3% |
| Yugoslavians | 1.0 /100 | #242 | Tragic 3.3% |
| Immigrants | Western Europe | 1.0 /100 | #243 | Tragic 3.3% |
| Assyrians/Chaldeans/Syriacs | 0.9 /100 | #244 | Tragic 3.3% |
| Immigrants | Scotland | 0.8 /100 | #245 | Tragic 3.3% |
| Immigrants | England | 0.7 /100 | #246 | Tragic 3.3% |
| Lithuanians | 0.6 /100 | #247 | Tragic 3.4% |
| Austrians | 0.6 /100 | #248 | Tragic 3.4% |
| Italians | 0.4 /100 | #249 | Tragic 3.4% |
| Yuman | 0.4 /100 | #250 | Tragic 3.4% |
| Hungarians | 0.4 /100 | #251 | Tragic 3.4% |
| Croatians | 0.4 /100 | #252 | Tragic 3.4% |
Demographics Similar to Bermudans by Hearing Disability
In terms of hearing disability, the demographic groups most similar to Bermudans are Immigrants from Jordan (2.9%, a difference of 0.020%), Sri Lankan (2.9%, a difference of 0.050%), Immigrants from Costa Rica (2.9%, a difference of 0.050%), Subsaharan African (2.9%, a difference of 0.090%), and Immigrants from Brazil (2.9%, a difference of 0.15%).
| Demographics | Rating | Rank | Hearing Disability |
| Chileans | 85.8 /100 | #132 | Excellent 2.9% |
| Immigrants | Syria | 85.8 /100 | #133 | Excellent 2.9% |
| Ugandans | 85.5 /100 | #134 | Excellent 2.9% |
| Soviet Union | 84.8 /100 | #135 | Excellent 2.9% |
| Immigrants | Brazil | 84.6 /100 | #136 | Excellent 2.9% |
| Sri Lankans | 84.1 /100 | #137 | Excellent 2.9% |
| Immigrants | Costa Rica | 84.0 /100 | #138 | Excellent 2.9% |
| Bermudans | 83.8 /100 | #139 | Excellent 2.9% |
| Immigrants | Jordan | 83.7 /100 | #140 | Excellent 2.9% |
| Sub-Saharan Africans | 83.3 /100 | #141 | Excellent 2.9% |
| Laotians | 81.1 /100 | #142 | Excellent 2.9% |
| Immigrants | Bahamas | 80.9 /100 | #143 | Excellent 2.9% |
| Immigrants | Bulgaria | 79.2 /100 | #144 | Good 2.9% |
| Immigrants | Congo | 78.9 /100 | #145 | Good 2.9% |
| Brazilians | 78.7 /100 | #146 | Good 2.9% |