Hopi vs Bermudan Hearing Disability
COMPARE
Hopi
Bermudan
Hearing Disability
Hearing Disability Comparison
Hopi
Bermudans
3.9%
HEARING DISABILITY
0.0/ 100
METRIC RATING
313th/ 347
METRIC RANK
2.9%
HEARING DISABILITY
83.8/ 100
METRIC RATING
139th/ 347
METRIC RANK
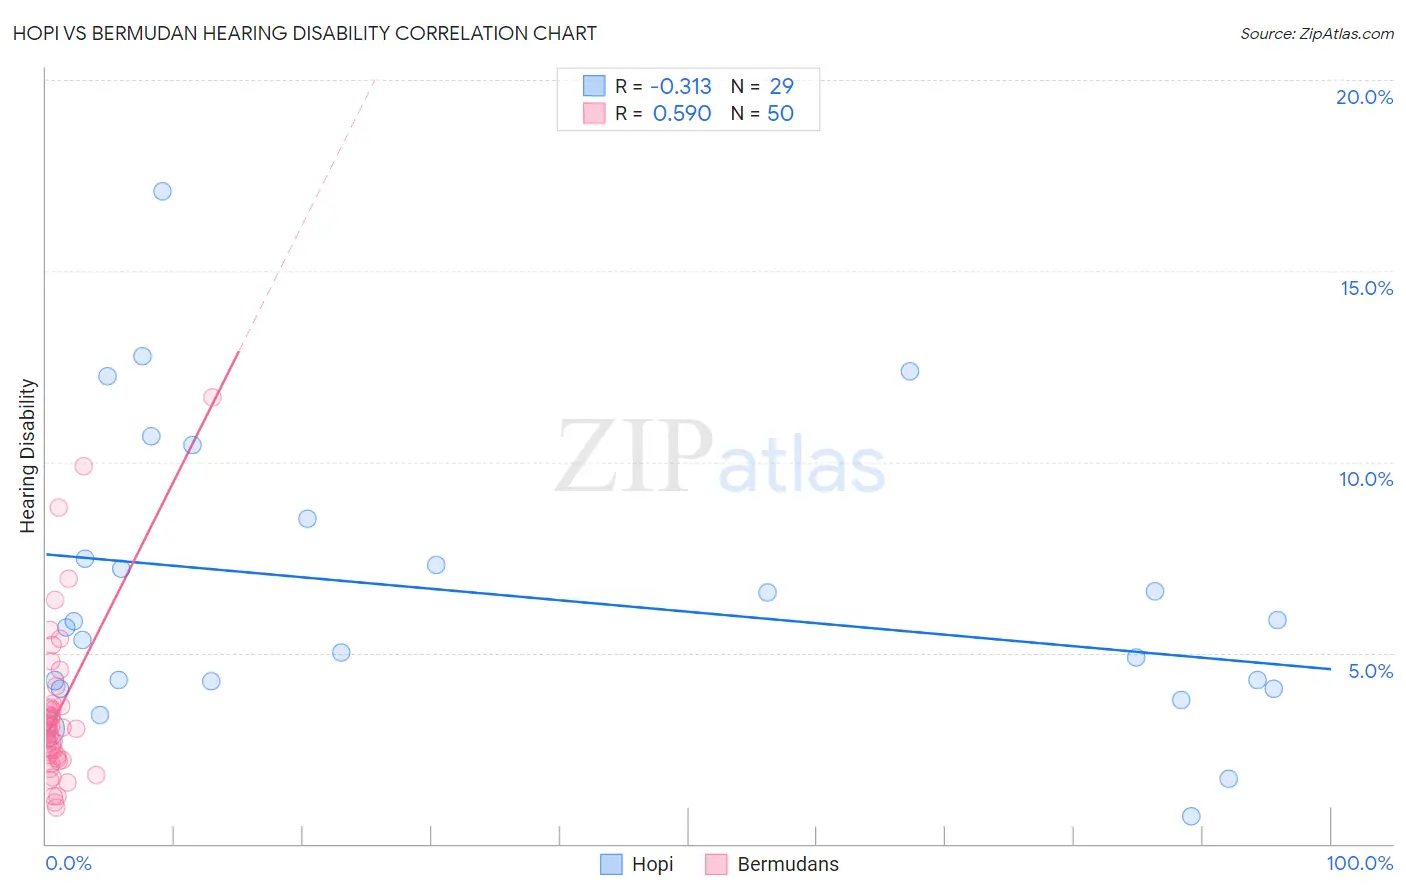
Hopi vs Bermudan Hearing Disability Correlation Chart
The statistical analysis conducted on geographies consisting of 74,726,897 people shows a mild negative correlation between the proportion of Hopi and percentage of population with hearing disability in the United States with a correlation coefficient (R) of -0.313 and weighted average of 3.9%. Similarly, the statistical analysis conducted on geographies consisting of 55,720,149 people shows a substantial positive correlation between the proportion of Bermudans and percentage of population with hearing disability in the United States with a correlation coefficient (R) of 0.590 and weighted average of 2.9%, a difference of 36.9%.
Hearing Disability Correlation Summary
| Measurement | Hopi | Bermudan |
| Minimum | 0.73% | 0.95% |
| Maximum | 17.1% | 11.7% |
| Range | 16.3% | 10.7% |
| Mean | 6.5% | 3.5% |
| Median | 5.7% | 3.0% |
| Interquartile 25% (IQ1) | 4.2% | 2.2% |
| Interquartile 75% (IQ3) | 8.0% | 3.6% |
| Interquartile Range (IQR) | 3.8% | 1.4% |
| Standard Deviation (Sample) | 3.7% | 2.1% |
| Standard Deviation (Population) | 3.6% | 2.1% |
Similar Demographics by Hearing Disability
Demographics Similar to Hopi by Hearing Disability
In terms of hearing disability, the demographic groups most similar to Hopi are Cajun (3.9%, a difference of 0.11%), Yakama (3.9%, a difference of 0.17%), Puget Sound Salish (3.9%, a difference of 0.18%), Spanish American (4.0%, a difference of 0.38%), and Comanche (4.0%, a difference of 0.51%).
| Demographics | Rating | Rank | Hearing Disability |
| Marshallese | 0.0 /100 | #306 | Tragic 3.8% |
| French Canadians | 0.0 /100 | #307 | Tragic 3.8% |
| Ottawa | 0.0 /100 | #308 | Tragic 3.8% |
| Scotch-Irish | 0.0 /100 | #309 | Tragic 3.8% |
| Cree | 0.0 /100 | #310 | Tragic 3.8% |
| Americans | 0.0 /100 | #311 | Tragic 3.9% |
| Cajuns | 0.0 /100 | #312 | Tragic 3.9% |
| Hopi | 0.0 /100 | #313 | Tragic 3.9% |
| Yakama | 0.0 /100 | #314 | Tragic 3.9% |
| Puget Sound Salish | 0.0 /100 | #315 | Tragic 3.9% |
| Spanish Americans | 0.0 /100 | #316 | Tragic 4.0% |
| Comanche | 0.0 /100 | #317 | Tragic 4.0% |
| Cheyenne | 0.0 /100 | #318 | Tragic 4.0% |
| Chippewa | 0.0 /100 | #319 | Tragic 4.0% |
| Shoshone | 0.0 /100 | #320 | Tragic 4.0% |
Demographics Similar to Bermudans by Hearing Disability
In terms of hearing disability, the demographic groups most similar to Bermudans are Immigrants from Jordan (2.9%, a difference of 0.020%), Sri Lankan (2.9%, a difference of 0.050%), Immigrants from Costa Rica (2.9%, a difference of 0.050%), Subsaharan African (2.9%, a difference of 0.090%), and Immigrants from Brazil (2.9%, a difference of 0.15%).
| Demographics | Rating | Rank | Hearing Disability |
| Chileans | 85.8 /100 | #132 | Excellent 2.9% |
| Immigrants | Syria | 85.8 /100 | #133 | Excellent 2.9% |
| Ugandans | 85.5 /100 | #134 | Excellent 2.9% |
| Soviet Union | 84.8 /100 | #135 | Excellent 2.9% |
| Immigrants | Brazil | 84.6 /100 | #136 | Excellent 2.9% |
| Sri Lankans | 84.1 /100 | #137 | Excellent 2.9% |
| Immigrants | Costa Rica | 84.0 /100 | #138 | Excellent 2.9% |
| Bermudans | 83.8 /100 | #139 | Excellent 2.9% |
| Immigrants | Jordan | 83.7 /100 | #140 | Excellent 2.9% |
| Sub-Saharan Africans | 83.3 /100 | #141 | Excellent 2.9% |
| Laotians | 81.1 /100 | #142 | Excellent 2.9% |
| Immigrants | Bahamas | 80.9 /100 | #143 | Excellent 2.9% |
| Immigrants | Bulgaria | 79.2 /100 | #144 | Good 2.9% |
| Immigrants | Congo | 78.9 /100 | #145 | Good 2.9% |
| Brazilians | 78.7 /100 | #146 | Good 2.9% |