Finnish vs Bermudan Hearing Disability
COMPARE
Finnish
Bermudan
Hearing Disability
Hearing Disability Comparison
Finns
Bermudans
3.7%
HEARING DISABILITY
0.0/ 100
METRIC RATING
291st/ 347
METRIC RANK
2.9%
HEARING DISABILITY
83.8/ 100
METRIC RATING
139th/ 347
METRIC RANK
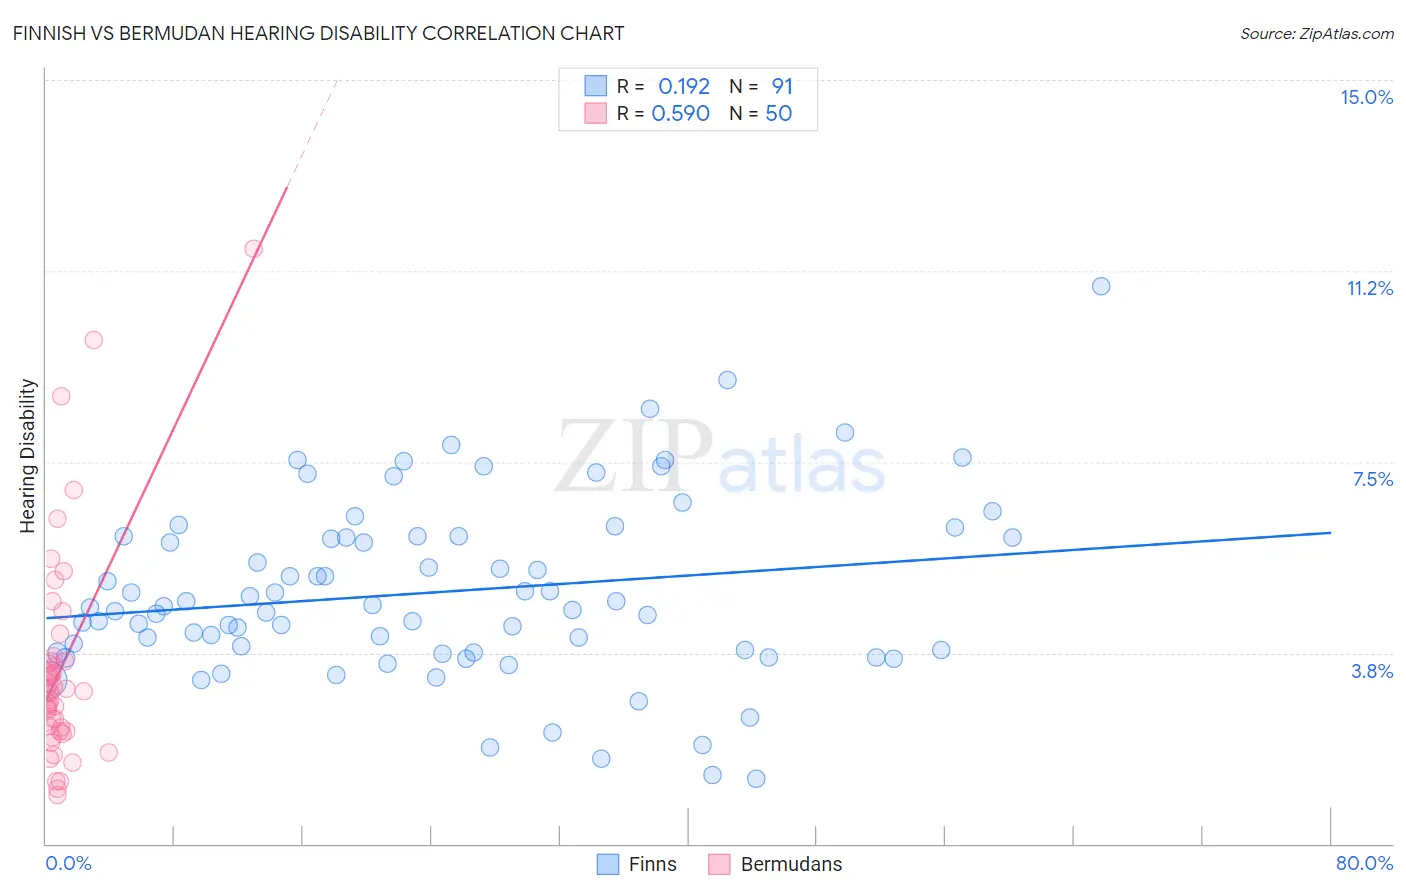
Finnish vs Bermudan Hearing Disability Correlation Chart
The statistical analysis conducted on geographies consisting of 404,503,893 people shows a poor positive correlation between the proportion of Finns and percentage of population with hearing disability in the United States with a correlation coefficient (R) of 0.192 and weighted average of 3.7%. Similarly, the statistical analysis conducted on geographies consisting of 55,720,149 people shows a substantial positive correlation between the proportion of Bermudans and percentage of population with hearing disability in the United States with a correlation coefficient (R) of 0.590 and weighted average of 2.9%, a difference of 28.0%.
Hearing Disability Correlation Summary
| Measurement | Finnish | Bermudan |
| Minimum | 1.3% | 0.95% |
| Maximum | 10.9% | 11.7% |
| Range | 9.7% | 10.7% |
| Mean | 4.9% | 3.5% |
| Median | 4.6% | 3.0% |
| Interquartile 25% (IQ1) | 3.8% | 2.2% |
| Interquartile 75% (IQ3) | 6.0% | 3.6% |
| Interquartile Range (IQR) | 2.3% | 1.4% |
| Standard Deviation (Sample) | 1.8% | 2.1% |
| Standard Deviation (Population) | 1.8% | 2.1% |
Similar Demographics by Hearing Disability
Demographics Similar to Finns by Hearing Disability
In terms of hearing disability, the demographic groups most similar to Finns are White/Caucasian (3.7%, a difference of 0.010%), Native Hawaiian (3.7%, a difference of 0.060%), Norwegian (3.7%, a difference of 0.12%), Chinese (3.7%, a difference of 0.15%), and Irish (3.7%, a difference of 0.35%).
| Demographics | Rating | Rank | Hearing Disability |
| Immigrants | Micronesia | 0.0 /100 | #284 | Tragic 3.6% |
| Sioux | 0.0 /100 | #285 | Tragic 3.6% |
| Delaware | 0.0 /100 | #286 | Tragic 3.6% |
| Spanish | 0.0 /100 | #287 | Tragic 3.7% |
| Irish | 0.0 /100 | #288 | Tragic 3.7% |
| Chinese | 0.0 /100 | #289 | Tragic 3.7% |
| Whites/Caucasians | 0.0 /100 | #290 | Tragic 3.7% |
| Finns | 0.0 /100 | #291 | Tragic 3.7% |
| Native Hawaiians | 0.0 /100 | #292 | Tragic 3.7% |
| Norwegians | 0.0 /100 | #293 | Tragic 3.7% |
| Iroquois | 0.0 /100 | #294 | Tragic 3.7% |
| Welsh | 0.0 /100 | #295 | Tragic 3.7% |
| Pima | 0.0 /100 | #296 | Tragic 3.7% |
| Immigrants | Azores | 0.0 /100 | #297 | Tragic 3.7% |
| Celtics | 0.0 /100 | #298 | Tragic 3.7% |
Demographics Similar to Bermudans by Hearing Disability
In terms of hearing disability, the demographic groups most similar to Bermudans are Immigrants from Jordan (2.9%, a difference of 0.020%), Sri Lankan (2.9%, a difference of 0.050%), Immigrants from Costa Rica (2.9%, a difference of 0.050%), Subsaharan African (2.9%, a difference of 0.090%), and Immigrants from Brazil (2.9%, a difference of 0.15%).
| Demographics | Rating | Rank | Hearing Disability |
| Chileans | 85.8 /100 | #132 | Excellent 2.9% |
| Immigrants | Syria | 85.8 /100 | #133 | Excellent 2.9% |
| Ugandans | 85.5 /100 | #134 | Excellent 2.9% |
| Soviet Union | 84.8 /100 | #135 | Excellent 2.9% |
| Immigrants | Brazil | 84.6 /100 | #136 | Excellent 2.9% |
| Sri Lankans | 84.1 /100 | #137 | Excellent 2.9% |
| Immigrants | Costa Rica | 84.0 /100 | #138 | Excellent 2.9% |
| Bermudans | 83.8 /100 | #139 | Excellent 2.9% |
| Immigrants | Jordan | 83.7 /100 | #140 | Excellent 2.9% |
| Sub-Saharan Africans | 83.3 /100 | #141 | Excellent 2.9% |
| Laotians | 81.1 /100 | #142 | Excellent 2.9% |
| Immigrants | Bahamas | 80.9 /100 | #143 | Excellent 2.9% |
| Immigrants | Bulgaria | 79.2 /100 | #144 | Good 2.9% |
| Immigrants | Congo | 78.9 /100 | #145 | Good 2.9% |
| Brazilians | 78.7 /100 | #146 | Good 2.9% |