Immigrants from Denmark vs Bermudan Hearing Disability
COMPARE
Immigrants from Denmark
Bermudan
Hearing Disability
Hearing Disability Comparison
Immigrants from Denmark
Bermudans
3.1%
HEARING DISABILITY
16.2/ 100
METRIC RATING
203rd/ 347
METRIC RANK
2.9%
HEARING DISABILITY
83.8/ 100
METRIC RATING
139th/ 347
METRIC RANK
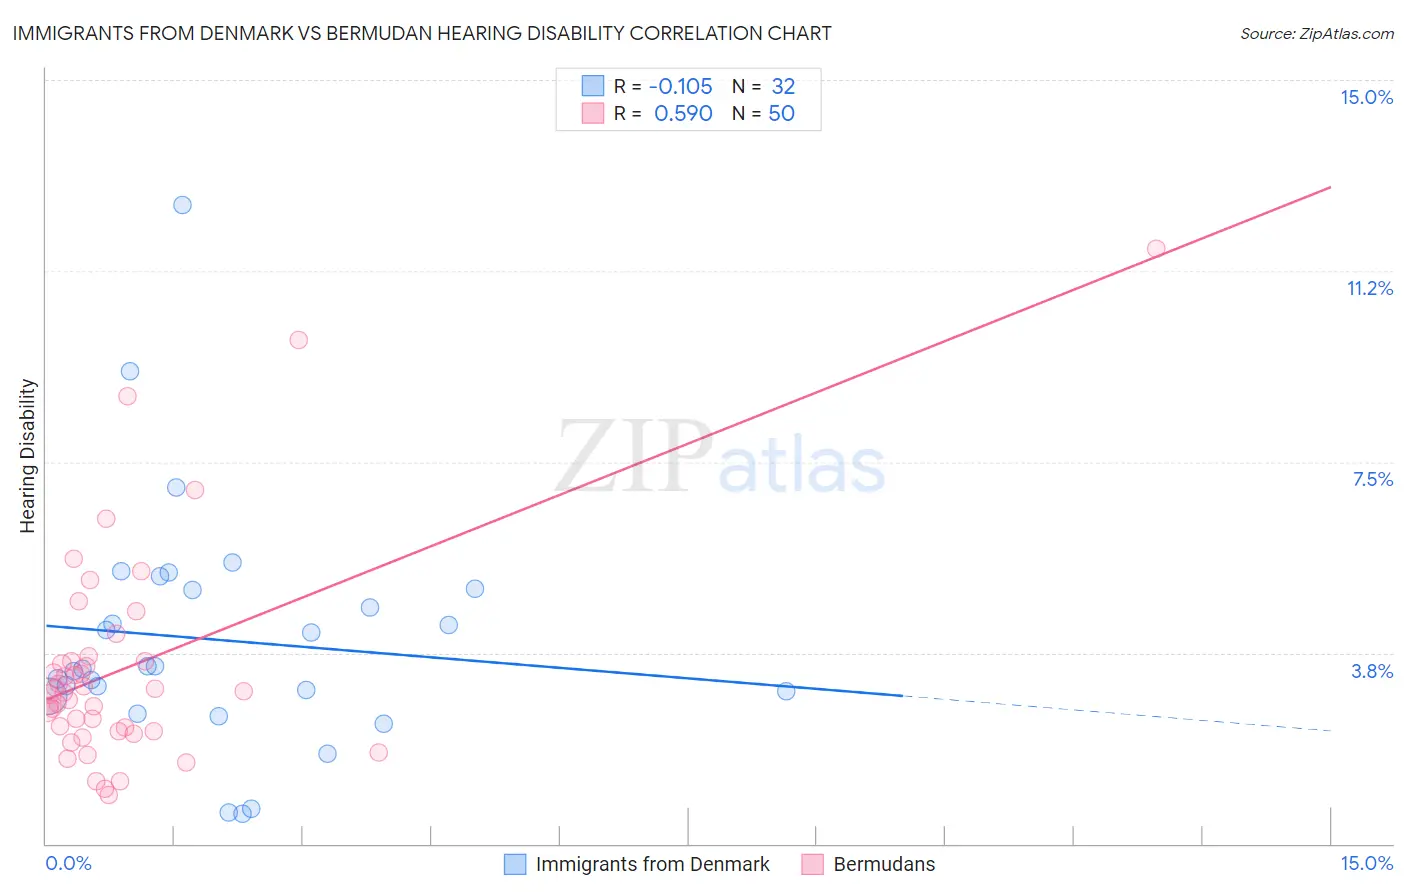
Immigrants from Denmark vs Bermudan Hearing Disability Correlation Chart
The statistical analysis conducted on geographies consisting of 136,425,612 people shows a poor negative correlation between the proportion of Immigrants from Denmark and percentage of population with hearing disability in the United States with a correlation coefficient (R) of -0.105 and weighted average of 3.1%. Similarly, the statistical analysis conducted on geographies consisting of 55,720,149 people shows a substantial positive correlation between the proportion of Bermudans and percentage of population with hearing disability in the United States with a correlation coefficient (R) of 0.590 and weighted average of 2.9%, a difference of 8.0%.
Hearing Disability Correlation Summary
| Measurement | Immigrants from Denmark | Bermudan |
| Minimum | 0.58% | 0.95% |
| Maximum | 12.5% | 11.7% |
| Range | 12.0% | 10.7% |
| Mean | 4.0% | 3.5% |
| Median | 3.5% | 3.0% |
| Interquartile 25% (IQ1) | 2.9% | 2.2% |
| Interquartile 75% (IQ3) | 5.0% | 3.6% |
| Interquartile Range (IQR) | 2.1% | 1.4% |
| Standard Deviation (Sample) | 2.4% | 2.1% |
| Standard Deviation (Population) | 2.3% | 2.1% |
Similar Demographics by Hearing Disability
Demographics Similar to Immigrants from Denmark by Hearing Disability
In terms of hearing disability, the demographic groups most similar to Immigrants from Denmark are Immigrants from Thailand (3.1%, a difference of 0.040%), Immigrants from Czechoslovakia (3.1%, a difference of 0.050%), Alsatian (3.1%, a difference of 0.050%), Eastern European (3.1%, a difference of 0.12%), and Hispanic or Latino (3.1%, a difference of 0.18%).
| Demographics | Rating | Rank | Hearing Disability |
| Immigrants | Europe | 22.9 /100 | #196 | Fair 3.1% |
| Immigrants | Bosnia and Herzegovina | 20.6 /100 | #197 | Fair 3.1% |
| Immigrants | Croatia | 20.5 /100 | #198 | Fair 3.1% |
| Syrians | 19.2 /100 | #199 | Poor 3.1% |
| Immigrants | North Macedonia | 19.1 /100 | #200 | Poor 3.1% |
| Iraqis | 19.0 /100 | #201 | Poor 3.1% |
| Immigrants | Thailand | 16.4 /100 | #202 | Poor 3.1% |
| Immigrants | Denmark | 16.2 /100 | #203 | Poor 3.1% |
| Immigrants | Czechoslovakia | 15.9 /100 | #204 | Poor 3.1% |
| Alsatians | 15.9 /100 | #205 | Poor 3.1% |
| Eastern Europeans | 15.5 /100 | #206 | Poor 3.1% |
| Hispanics or Latinos | 15.1 /100 | #207 | Poor 3.1% |
| Immigrants | Latvia | 12.7 /100 | #208 | Poor 3.1% |
| Immigrants | Hungary | 12.5 /100 | #209 | Poor 3.1% |
| Cape Verdeans | 12.2 /100 | #210 | Poor 3.1% |
Demographics Similar to Bermudans by Hearing Disability
In terms of hearing disability, the demographic groups most similar to Bermudans are Immigrants from Jordan (2.9%, a difference of 0.020%), Sri Lankan (2.9%, a difference of 0.050%), Immigrants from Costa Rica (2.9%, a difference of 0.050%), Subsaharan African (2.9%, a difference of 0.090%), and Immigrants from Brazil (2.9%, a difference of 0.15%).
| Demographics | Rating | Rank | Hearing Disability |
| Chileans | 85.8 /100 | #132 | Excellent 2.9% |
| Immigrants | Syria | 85.8 /100 | #133 | Excellent 2.9% |
| Ugandans | 85.5 /100 | #134 | Excellent 2.9% |
| Soviet Union | 84.8 /100 | #135 | Excellent 2.9% |
| Immigrants | Brazil | 84.6 /100 | #136 | Excellent 2.9% |
| Sri Lankans | 84.1 /100 | #137 | Excellent 2.9% |
| Immigrants | Costa Rica | 84.0 /100 | #138 | Excellent 2.9% |
| Bermudans | 83.8 /100 | #139 | Excellent 2.9% |
| Immigrants | Jordan | 83.7 /100 | #140 | Excellent 2.9% |
| Sub-Saharan Africans | 83.3 /100 | #141 | Excellent 2.9% |
| Laotians | 81.1 /100 | #142 | Excellent 2.9% |
| Immigrants | Bahamas | 80.9 /100 | #143 | Excellent 2.9% |
| Immigrants | Bulgaria | 79.2 /100 | #144 | Good 2.9% |
| Immigrants | Congo | 78.9 /100 | #145 | Good 2.9% |
| Brazilians | 78.7 /100 | #146 | Good 2.9% |