Immigrants from Scotland vs Inupiat Hearing Disability
COMPARE
Immigrants from Scotland
Inupiat
Hearing Disability
Hearing Disability Comparison
Immigrants from Scotland
Inupiat
3.3%
HEARING DISABILITY
0.8/ 100
METRIC RATING
245th/ 347
METRIC RANK
4.7%
HEARING DISABILITY
0.0/ 100
METRIC RATING
343rd/ 347
METRIC RANK
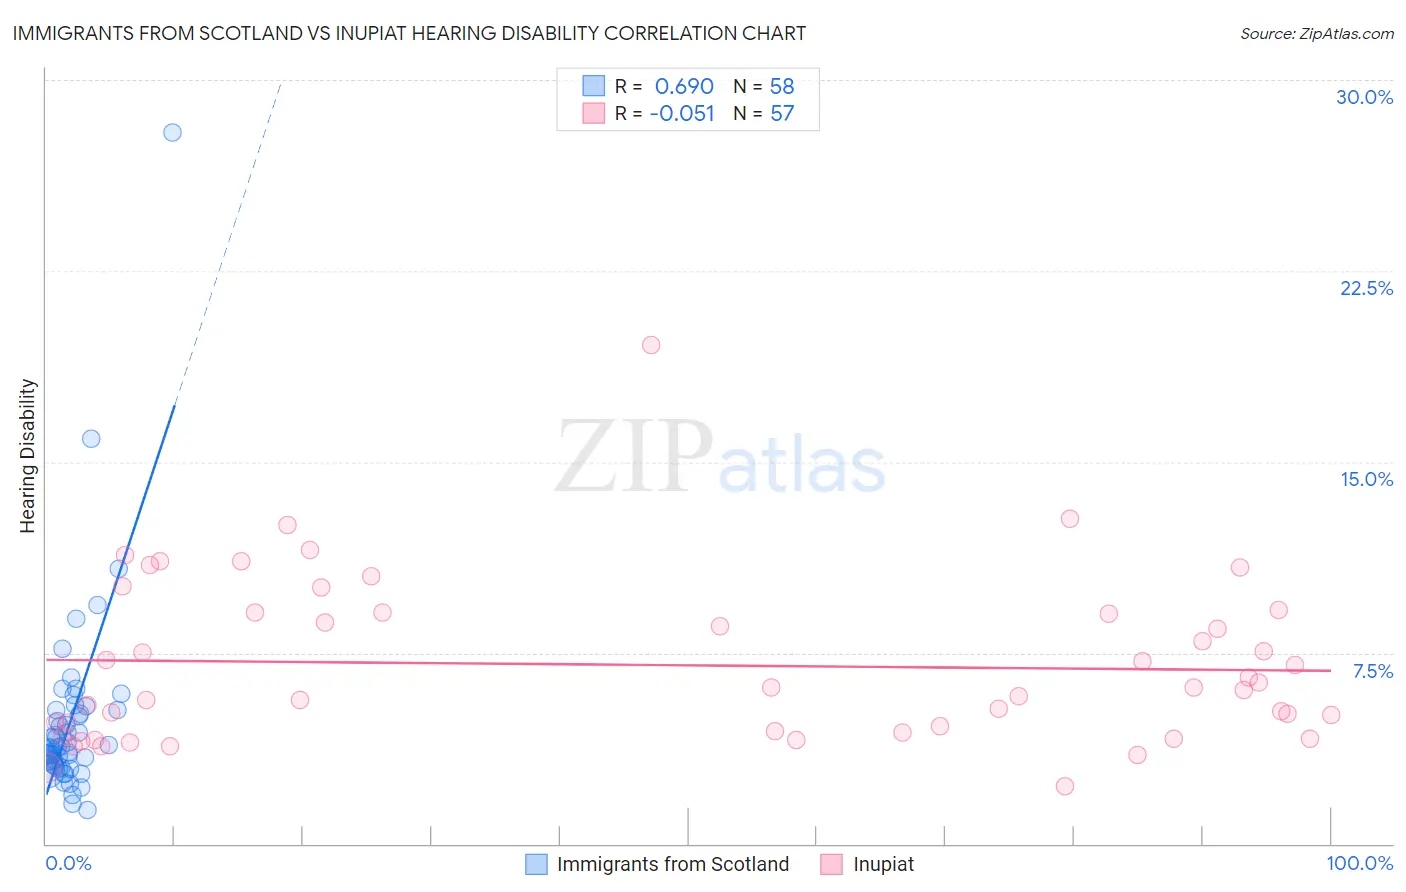
Immigrants from Scotland vs Inupiat Hearing Disability Correlation Chart
The statistical analysis conducted on geographies consisting of 196,388,915 people shows a significant positive correlation between the proportion of Immigrants from Scotland and percentage of population with hearing disability in the United States with a correlation coefficient (R) of 0.690 and weighted average of 3.3%. Similarly, the statistical analysis conducted on geographies consisting of 96,332,419 people shows a slight negative correlation between the proportion of Inupiat and percentage of population with hearing disability in the United States with a correlation coefficient (R) of -0.051 and weighted average of 4.7%, a difference of 41.3%.
Hearing Disability Correlation Summary
| Measurement | Immigrants from Scotland | Inupiat |
| Minimum | 1.3% | 2.3% |
| Maximum | 27.9% | 19.6% |
| Range | 26.6% | 17.3% |
| Mean | 4.8% | 7.0% |
| Median | 3.8% | 6.1% |
| Interquartile 25% (IQ1) | 3.1% | 4.4% |
| Interquartile 75% (IQ3) | 5.2% | 9.1% |
| Interquartile Range (IQR) | 2.1% | 4.7% |
| Standard Deviation (Sample) | 3.9% | 3.2% |
| Standard Deviation (Population) | 3.9% | 3.2% |
Similar Demographics by Hearing Disability
Demographics Similar to Immigrants from Scotland by Hearing Disability
In terms of hearing disability, the demographic groups most similar to Immigrants from Scotland are Immigrants from England (3.3%, a difference of 0.28%), Assyrian/Chaldean/Syriac (3.3%, a difference of 0.34%), Immigrants from Western Europe (3.3%, a difference of 0.41%), Lithuanian (3.4%, a difference of 0.48%), and Yugoslavian (3.3%, a difference of 0.58%).
| Demographics | Rating | Rank | Hearing Disability |
| German Russians | 1.8 /100 | #238 | Tragic 3.3% |
| Nepalese | 1.2 /100 | #239 | Tragic 3.3% |
| Immigrants | Netherlands | 1.1 /100 | #240 | Tragic 3.3% |
| Samoans | 1.1 /100 | #241 | Tragic 3.3% |
| Yugoslavians | 1.0 /100 | #242 | Tragic 3.3% |
| Immigrants | Western Europe | 1.0 /100 | #243 | Tragic 3.3% |
| Assyrians/Chaldeans/Syriacs | 0.9 /100 | #244 | Tragic 3.3% |
| Immigrants | Scotland | 0.8 /100 | #245 | Tragic 3.3% |
| Immigrants | England | 0.7 /100 | #246 | Tragic 3.3% |
| Lithuanians | 0.6 /100 | #247 | Tragic 3.4% |
| Austrians | 0.6 /100 | #248 | Tragic 3.4% |
| Italians | 0.4 /100 | #249 | Tragic 3.4% |
| Yuman | 0.4 /100 | #250 | Tragic 3.4% |
| Hungarians | 0.4 /100 | #251 | Tragic 3.4% |
| Croatians | 0.4 /100 | #252 | Tragic 3.4% |
Demographics Similar to Inupiat by Hearing Disability
In terms of hearing disability, the demographic groups most similar to Inupiat are Tsimshian (4.7%, a difference of 0.21%), Navajo (4.6%, a difference of 1.8%), Pueblo (4.6%, a difference of 2.1%), Tlingit-Haida (4.8%, a difference of 2.7%), and Choctaw (4.5%, a difference of 3.6%).
| Demographics | Rating | Rank | Hearing Disability |
| Dutch West Indians | 0.0 /100 | #333 | Tragic 4.3% |
| Aleuts | 0.0 /100 | #334 | Tragic 4.3% |
| Kiowa | 0.0 /100 | #335 | Tragic 4.3% |
| Creek | 0.0 /100 | #336 | Tragic 4.4% |
| Chickasaw | 0.0 /100 | #337 | Tragic 4.5% |
| Alaska Natives | 0.0 /100 | #338 | Tragic 4.5% |
| Choctaw | 0.0 /100 | #339 | Tragic 4.5% |
| Pueblo | 0.0 /100 | #340 | Tragic 4.6% |
| Navajo | 0.0 /100 | #341 | Tragic 4.6% |
| Tsimshian | 0.0 /100 | #342 | Tragic 4.7% |
| Inupiat | 0.0 /100 | #343 | Tragic 4.7% |
| Tlingit-Haida | 0.0 /100 | #344 | Tragic 4.8% |
| Alaskan Athabascans | 0.0 /100 | #345 | Tragic 5.3% |
| Colville | 0.0 /100 | #346 | Tragic 5.3% |
| Yup'ik | 0.0 /100 | #347 | Tragic 5.8% |