Immigrants from Scotland vs Haitian Hearing Disability
COMPARE
Immigrants from Scotland
Haitian
Hearing Disability
Hearing Disability Comparison
Immigrants from Scotland
Haitians
3.3%
HEARING DISABILITY
0.8/ 100
METRIC RATING
245th/ 347
METRIC RANK
2.6%
HEARING DISABILITY
99.5/ 100
METRIC RATING
40th/ 347
METRIC RANK
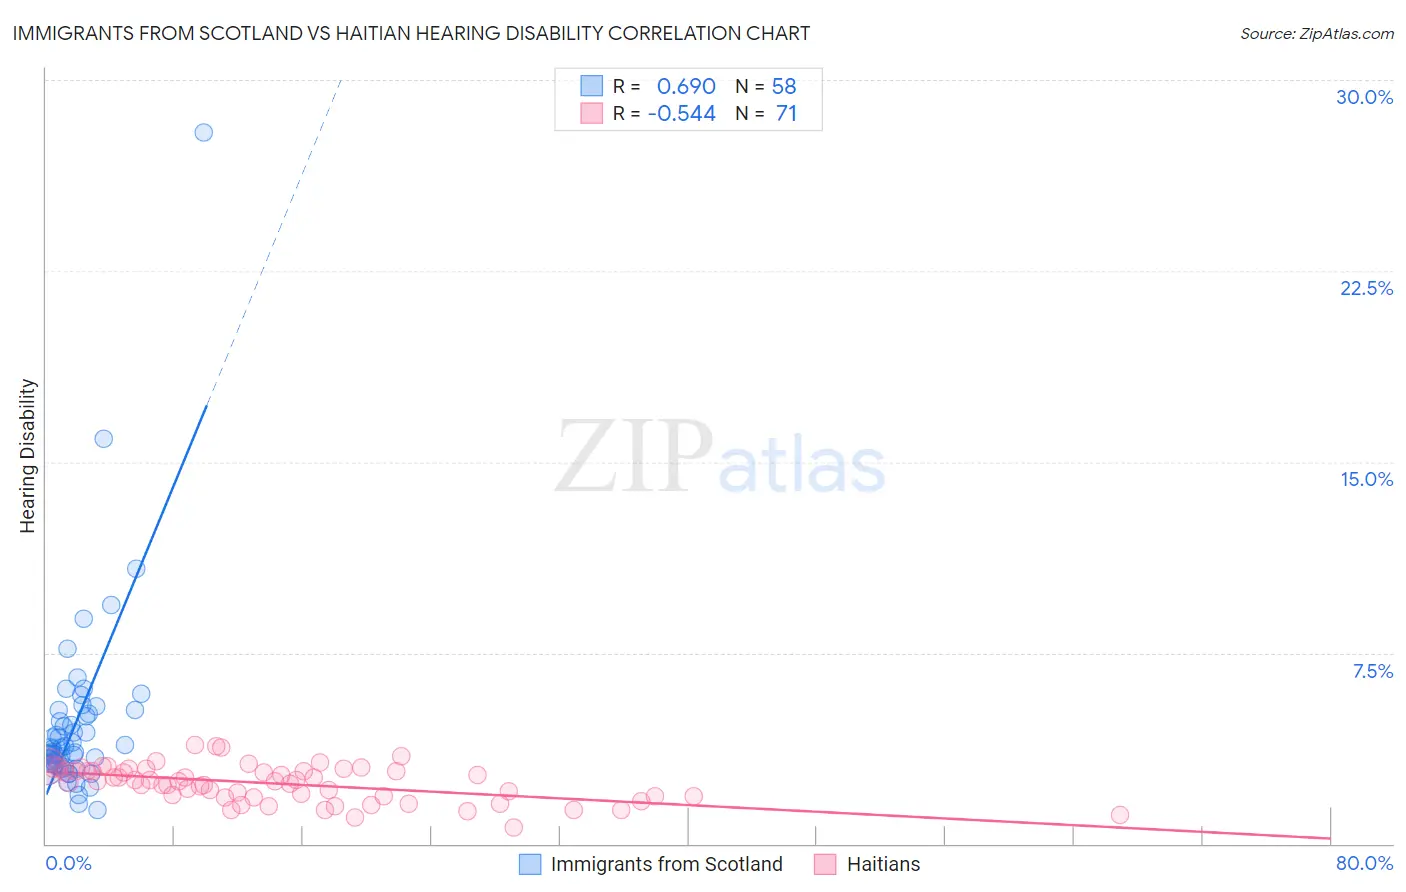
Immigrants from Scotland vs Haitian Hearing Disability Correlation Chart
The statistical analysis conducted on geographies consisting of 196,388,915 people shows a significant positive correlation between the proportion of Immigrants from Scotland and percentage of population with hearing disability in the United States with a correlation coefficient (R) of 0.690 and weighted average of 3.3%. Similarly, the statistical analysis conducted on geographies consisting of 287,794,704 people shows a substantial negative correlation between the proportion of Haitians and percentage of population with hearing disability in the United States with a correlation coefficient (R) of -0.544 and weighted average of 2.6%, a difference of 27.0%.
Hearing Disability Correlation Summary
| Measurement | Immigrants from Scotland | Haitian |
| Minimum | 1.3% | 0.62% |
| Maximum | 27.9% | 3.9% |
| Range | 26.6% | 3.3% |
| Mean | 4.8% | 2.4% |
| Median | 3.8% | 2.5% |
| Interquartile 25% (IQ1) | 3.1% | 1.8% |
| Interquartile 75% (IQ3) | 5.2% | 2.9% |
| Interquartile Range (IQR) | 2.1% | 1.0% |
| Standard Deviation (Sample) | 3.9% | 0.71% |
| Standard Deviation (Population) | 3.9% | 0.70% |
Similar Demographics by Hearing Disability
Demographics Similar to Immigrants from Scotland by Hearing Disability
In terms of hearing disability, the demographic groups most similar to Immigrants from Scotland are Immigrants from England (3.3%, a difference of 0.28%), Assyrian/Chaldean/Syriac (3.3%, a difference of 0.34%), Immigrants from Western Europe (3.3%, a difference of 0.41%), Lithuanian (3.4%, a difference of 0.48%), and Yugoslavian (3.3%, a difference of 0.58%).
| Demographics | Rating | Rank | Hearing Disability |
| German Russians | 1.8 /100 | #238 | Tragic 3.3% |
| Nepalese | 1.2 /100 | #239 | Tragic 3.3% |
| Immigrants | Netherlands | 1.1 /100 | #240 | Tragic 3.3% |
| Samoans | 1.1 /100 | #241 | Tragic 3.3% |
| Yugoslavians | 1.0 /100 | #242 | Tragic 3.3% |
| Immigrants | Western Europe | 1.0 /100 | #243 | Tragic 3.3% |
| Assyrians/Chaldeans/Syriacs | 0.9 /100 | #244 | Tragic 3.3% |
| Immigrants | Scotland | 0.8 /100 | #245 | Tragic 3.3% |
| Immigrants | England | 0.7 /100 | #246 | Tragic 3.3% |
| Lithuanians | 0.6 /100 | #247 | Tragic 3.4% |
| Austrians | 0.6 /100 | #248 | Tragic 3.4% |
| Italians | 0.4 /100 | #249 | Tragic 3.4% |
| Yuman | 0.4 /100 | #250 | Tragic 3.4% |
| Hungarians | 0.4 /100 | #251 | Tragic 3.4% |
| Croatians | 0.4 /100 | #252 | Tragic 3.4% |
Demographics Similar to Haitians by Hearing Disability
In terms of hearing disability, the demographic groups most similar to Haitians are Immigrants from China (2.6%, a difference of 0.080%), Immigrants from Jamaica (2.6%, a difference of 0.32%), Immigrants from Taiwan (2.6%, a difference of 0.34%), West Indian (2.6%, a difference of 0.34%), and Senegalese (2.6%, a difference of 0.35%).
| Demographics | Rating | Rank | Hearing Disability |
| Filipinos | 99.6 /100 | #33 | Exceptional 2.6% |
| Immigrants | Pakistan | 99.6 /100 | #34 | Exceptional 2.6% |
| Salvadorans | 99.6 /100 | #35 | Exceptional 2.6% |
| Okinawans | 99.6 /100 | #36 | Exceptional 2.6% |
| Immigrants | Western Africa | 99.6 /100 | #37 | Exceptional 2.6% |
| Immigrants | Jamaica | 99.5 /100 | #38 | Exceptional 2.6% |
| Immigrants | China | 99.5 /100 | #39 | Exceptional 2.6% |
| Haitians | 99.5 /100 | #40 | Exceptional 2.6% |
| Immigrants | Taiwan | 99.4 /100 | #41 | Exceptional 2.6% |
| West Indians | 99.4 /100 | #42 | Exceptional 2.6% |
| Senegalese | 99.4 /100 | #43 | Exceptional 2.6% |
| Nigerians | 99.4 /100 | #44 | Exceptional 2.6% |
| Venezuelans | 99.4 /100 | #45 | Exceptional 2.6% |
| Immigrants | Dominica | 99.3 /100 | #46 | Exceptional 2.6% |
| Immigrants | Israel | 99.3 /100 | #47 | Exceptional 2.6% |