Immigrants from Malaysia vs Bermudan Hearing Disability
COMPARE
Immigrants from Malaysia
Bermudan
Hearing Disability
Hearing Disability Comparison
Immigrants from Malaysia
Bermudans
2.7%
HEARING DISABILITY
97.5/ 100
METRIC RATING
77th/ 347
METRIC RANK
2.9%
HEARING DISABILITY
83.8/ 100
METRIC RATING
139th/ 347
METRIC RANK
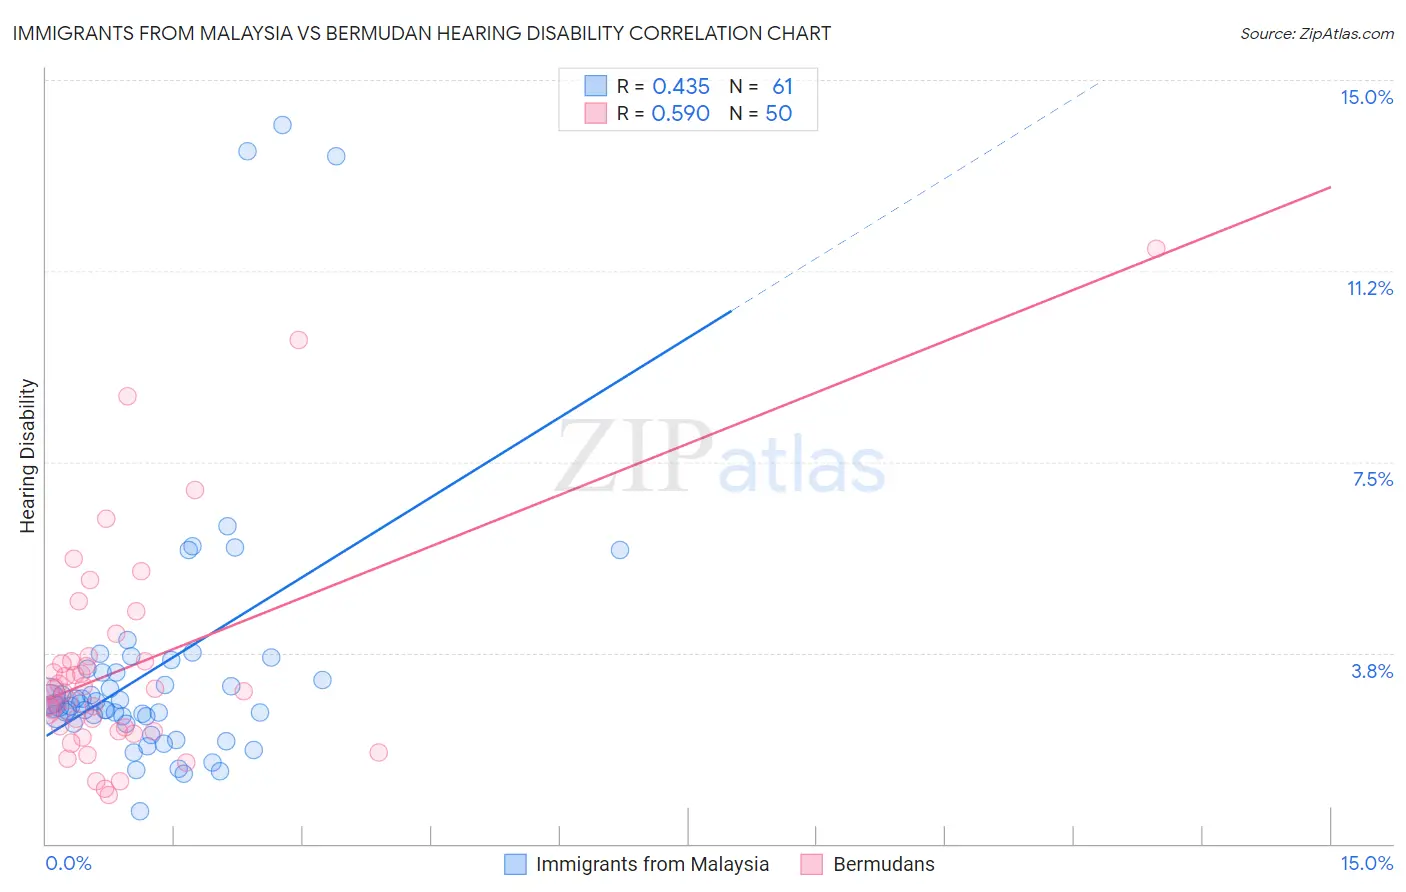
Immigrants from Malaysia vs Bermudan Hearing Disability Correlation Chart
The statistical analysis conducted on geographies consisting of 197,956,829 people shows a moderate positive correlation between the proportion of Immigrants from Malaysia and percentage of population with hearing disability in the United States with a correlation coefficient (R) of 0.435 and weighted average of 2.7%. Similarly, the statistical analysis conducted on geographies consisting of 55,720,149 people shows a substantial positive correlation between the proportion of Bermudans and percentage of population with hearing disability in the United States with a correlation coefficient (R) of 0.590 and weighted average of 2.9%, a difference of 5.2%.
Hearing Disability Correlation Summary
| Measurement | Immigrants from Malaysia | Bermudan |
| Minimum | 0.63% | 0.95% |
| Maximum | 14.1% | 11.7% |
| Range | 13.5% | 10.7% |
| Mean | 3.4% | 3.5% |
| Median | 2.7% | 3.0% |
| Interquartile 25% (IQ1) | 2.4% | 2.2% |
| Interquartile 75% (IQ3) | 3.4% | 3.6% |
| Interquartile Range (IQR) | 0.98% | 1.4% |
| Standard Deviation (Sample) | 2.6% | 2.1% |
| Standard Deviation (Population) | 2.6% | 2.1% |
Similar Demographics by Hearing Disability
Demographics Similar to Immigrants from Malaysia by Hearing Disability
In terms of hearing disability, the demographic groups most similar to Immigrants from Malaysia are Asian (2.7%, a difference of 0.020%), Immigrants from Saudi Arabia (2.7%, a difference of 0.030%), Mongolian (2.7%, a difference of 0.040%), Immigrants from Korea (2.7%, a difference of 0.050%), and Argentinean (2.7%, a difference of 0.060%).
| Demographics | Rating | Rank | Hearing Disability |
| Peruvians | 97.7 /100 | #70 | Exceptional 2.7% |
| Central Americans | 97.7 /100 | #71 | Exceptional 2.7% |
| Afghans | 97.6 /100 | #72 | Exceptional 2.7% |
| Argentineans | 97.5 /100 | #73 | Exceptional 2.7% |
| Immigrants | Korea | 97.5 /100 | #74 | Exceptional 2.7% |
| Immigrants | Saudi Arabia | 97.5 /100 | #75 | Exceptional 2.7% |
| Asians | 97.5 /100 | #76 | Exceptional 2.7% |
| Immigrants | Malaysia | 97.5 /100 | #77 | Exceptional 2.7% |
| Mongolians | 97.4 /100 | #78 | Exceptional 2.7% |
| Colombians | 97.4 /100 | #79 | Exceptional 2.7% |
| Immigrants | Asia | 97.2 /100 | #80 | Exceptional 2.7% |
| Immigrants | Uruguay | 97.2 /100 | #81 | Exceptional 2.7% |
| Immigrants | Armenia | 97.2 /100 | #82 | Exceptional 2.7% |
| Immigrants | Cuba | 97.2 /100 | #83 | Exceptional 2.7% |
| Immigrants | Argentina | 97.0 /100 | #84 | Exceptional 2.8% |
Demographics Similar to Bermudans by Hearing Disability
In terms of hearing disability, the demographic groups most similar to Bermudans are Immigrants from Jordan (2.9%, a difference of 0.020%), Sri Lankan (2.9%, a difference of 0.050%), Immigrants from Costa Rica (2.9%, a difference of 0.050%), Subsaharan African (2.9%, a difference of 0.090%), and Immigrants from Brazil (2.9%, a difference of 0.15%).
| Demographics | Rating | Rank | Hearing Disability |
| Chileans | 85.8 /100 | #132 | Excellent 2.9% |
| Immigrants | Syria | 85.8 /100 | #133 | Excellent 2.9% |
| Ugandans | 85.5 /100 | #134 | Excellent 2.9% |
| Soviet Union | 84.8 /100 | #135 | Excellent 2.9% |
| Immigrants | Brazil | 84.6 /100 | #136 | Excellent 2.9% |
| Sri Lankans | 84.1 /100 | #137 | Excellent 2.9% |
| Immigrants | Costa Rica | 84.0 /100 | #138 | Excellent 2.9% |
| Bermudans | 83.8 /100 | #139 | Excellent 2.9% |
| Immigrants | Jordan | 83.7 /100 | #140 | Excellent 2.9% |
| Sub-Saharan Africans | 83.3 /100 | #141 | Excellent 2.9% |
| Laotians | 81.1 /100 | #142 | Excellent 2.9% |
| Immigrants | Bahamas | 80.9 /100 | #143 | Excellent 2.9% |
| Immigrants | Bulgaria | 79.2 /100 | #144 | Good 2.9% |
| Immigrants | Congo | 78.9 /100 | #145 | Good 2.9% |
| Brazilians | 78.7 /100 | #146 | Good 2.9% |